
Trade The World
NZD/USD Price Analysis: Reversal points to weekly losses as bears regain control
作者 Christian Borjon Valencia
發布日期: 16 Aug 2025 | 修改日期: 16 Aug 2025


POPULAR ARTICLES

the
the
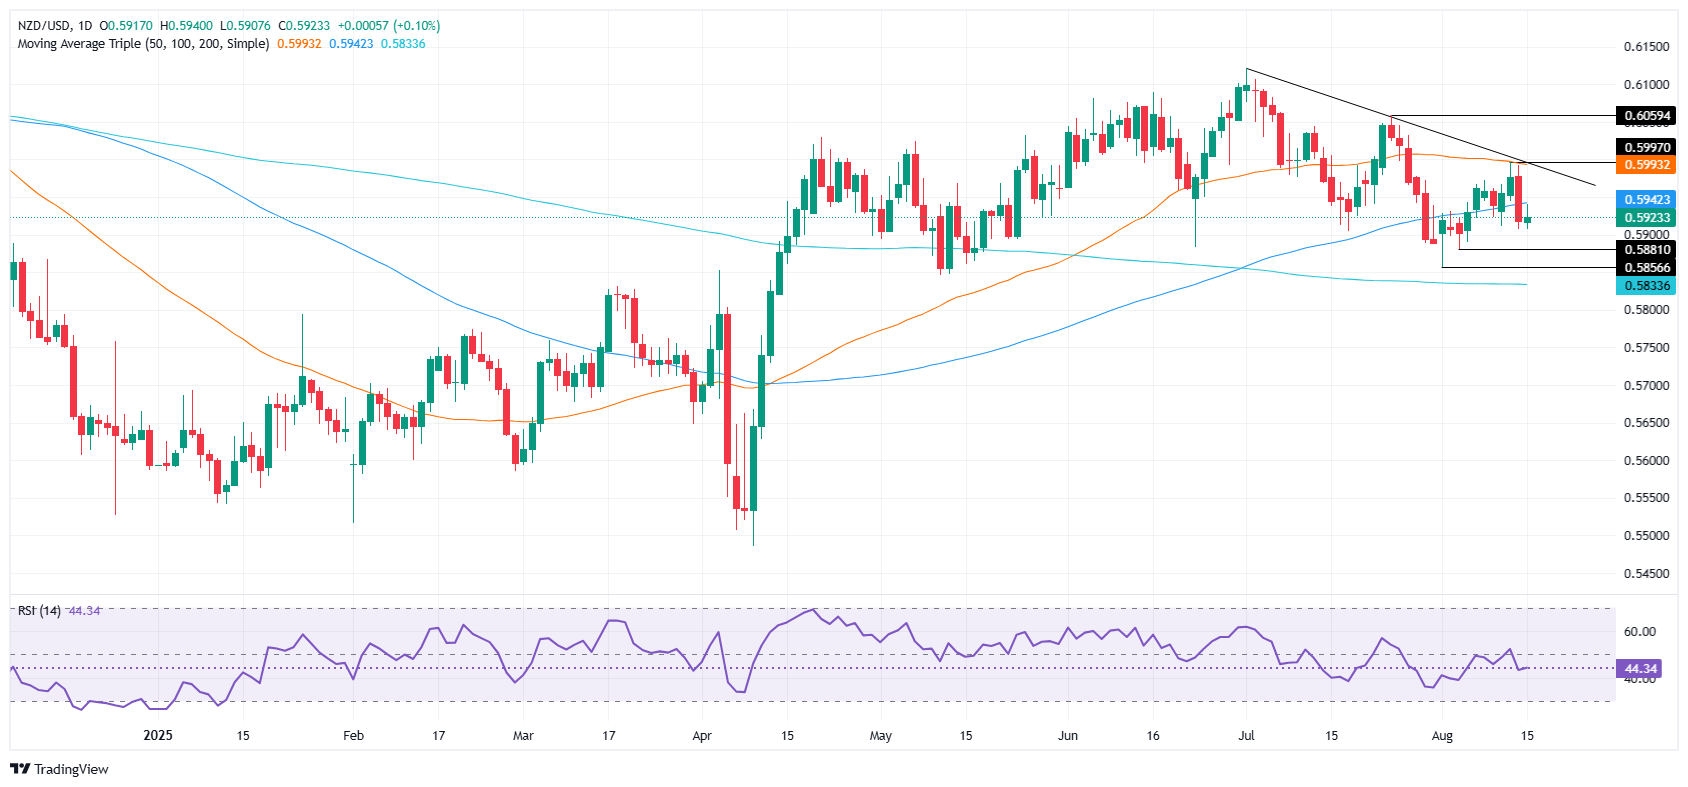
- NZD/USD set for 0.49% weekly loss, trading near 0.5923 after rejection from 0.5994 resistance.
- Pair slips below 50 and 100-day SMAs, turning them into key short-term resistance levels.
- RSI momentum shifts bearish, opening the path toward 0.5900 and August lows near 0.5856.
The New Zealand Dollar (NZD) halted its rally and turned negative, poised to finish 0.49% down in the week, after failing to clear key resistance levels, which paved the way for a drop towards the weekly lows near 0.5900. NZD/USD trades at 0.5923, down 0.09%.
NZD/USD Price Forecast: Technical outlook
From a daily chart perspective, the pair trades sideways to downward biased after NZD/USD faced key resistance at 0.5994, with traders lacking the strength to reclaim the 0.60 handle. On its way south, the pair cleared the 50 and 100-day SMAs, each at 0.5952 and 0.5944, respectively, which turned key resistance levels at the time of writing.
The Relative Strength Index (RSI) turned bearish two days ago. This means that sellers are in charge in the near-term.
For a bearish continuation, the first support would be 0.5900. A breach of the latter will expose the August 5 low of 0.5881, before testing the current month’s low of 0.5856. Conversely, the pair could shift upwards if traders reclaim 0.5952 and the 0.6000 figure.
NZD/USD Price Chart – Daily
New Zealand Dollar PRICE This week
The table below shows the percentage change of New Zealand Dollar (NZD) against listed major currencies this week. New Zealand Dollar was the strongest against the Canadian Dollar.
| USD | EUR | GBP | JPY | CAD | AUD | NZD | CHF | |
|---|---|---|---|---|---|---|---|---|
| USD | -0.46% | -0.75% | -0.22% | 0.45% | 0.26% | 0.60% | -0.27% | |
| EUR | 0.46% | -0.29% | 0.24% | 0.92% | 0.73% | 1.02% | 0.20% | |
| GBP | 0.75% | 0.29% | 0.50% | 1.21% | 1.02% | 1.31% | 0.49% | |
| JPY | 0.22% | -0.24% | -0.50% | 0.71% | 0.53% | 0.89% | 0.10% | |
| CAD | -0.45% | -0.92% | -1.21% | -0.71% | -0.18% | 0.10% | -0.74% | |
| AUD | -0.26% | -0.73% | -1.02% | -0.53% | 0.18% | 0.29% | -0.53% | |
| NZD | -0.60% | -1.02% | -1.31% | -0.89% | -0.10% | -0.29% | -0.81% | |
| CHF | 0.27% | -0.20% | -0.49% | -0.10% | 0.74% | 0.53% | 0.81% |
The heat map shows percentage changes of major currencies against each other. The base currency is picked from the left column, while the quote currency is picked from the top row. For example, if you pick the New Zealand Dollar from the left column and move along the horizontal line to the US Dollar, the percentage change displayed in the box will represent NZD (base)/USD (quote).

Acuity Trading
Acuity Trading 是一家成立於 2013 年、總部位於倫敦的金融科技公司,專注於 AI 驅動的另類數據與情緒分析,用於交易與投資。他們以可視化新聞與情緒工具革新線上交易體驗,並持續以最新 AI 研究與技術提供可產生阿爾法的另類數據與高度互動的交易工具。
Read More


