
Stellar Price Forecast: XLM slips below $0.22 as bearish momentum builds
作者 Manish Chhetri
發布日期: 24 Dec 2025 | 修改日期: 24 Dec 2025


熱門文章
Stellar (XLM) price is trading below $0.22 at the time of writing on Wednesday after failing to close above the key resistance earlier this week. Bearish momentum continues to strengthen, with open interest falling and short bets rising.
- Stellar price slips below $0.22 on Wednesday after failing to break through the weekly resistance earlier this week.
- XLM’s declining open interest and rising short bets in the derivatives market reinforce bearish sentiment.
- The technical outlook supports further correction, with bears aiming for levels below $0.20.
Stellar (XLM) price is trading below $0.22 at the time of writing on Wednesday after failing to close above the key resistance earlier this week. Bearish momentum continues to strengthen, with open interest falling and short bets rising. On the technical side, XLM price action suggests further downside, targeting levels below $0.20.
XLM derivatives data signals bearish sentiment
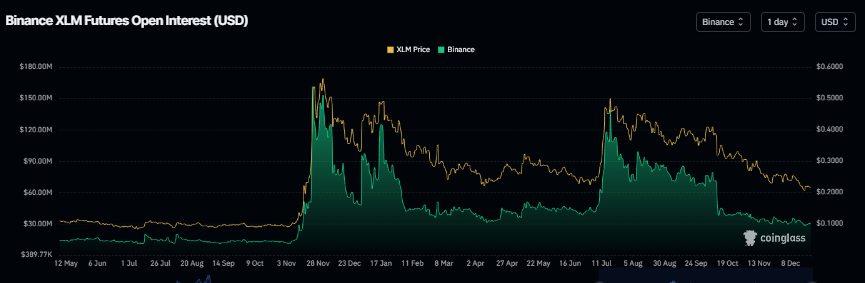
Stellar’s derivatives data sports a bearish outlook. XLM’s futures Open Interest (OI) dropped to $30.30 million on Wednesday, nearing its yearly low, according to Coinglass data. This drop in OI reflects waning investor participation and projects a bearish outlook.
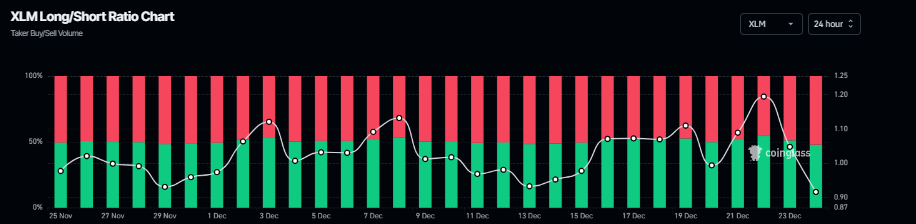
In addition, Coinglass’s long-to-short ratio for XLM reads 0.91 on Wednesday, the highest level over a month. The ratio below one suggests bearish sentiment in the market, as more traders are betting on the XLM price to fall.
Stellar Price Forecast: XLM faces rejection from key resistance
Stellar price was rejected at the weekly resistance level of $0.22 on Tuesday and declined 1.5% that day. As of Wednesday, XLM is trading at $0.21.
If XLM continues its correction, it could extend toward the December 18 low at $0.20. A close below this level could extend the drop toward the yearly low of $0.16, set on October 10.
The Relative Strength Index (RSI) on the daily chart is at 37, below the neutral 50 level, indicating bearish momentum is gaining traction. The Moving Average Convergence Divergence (MACD) lines are also converging, indicating indecision among traders.
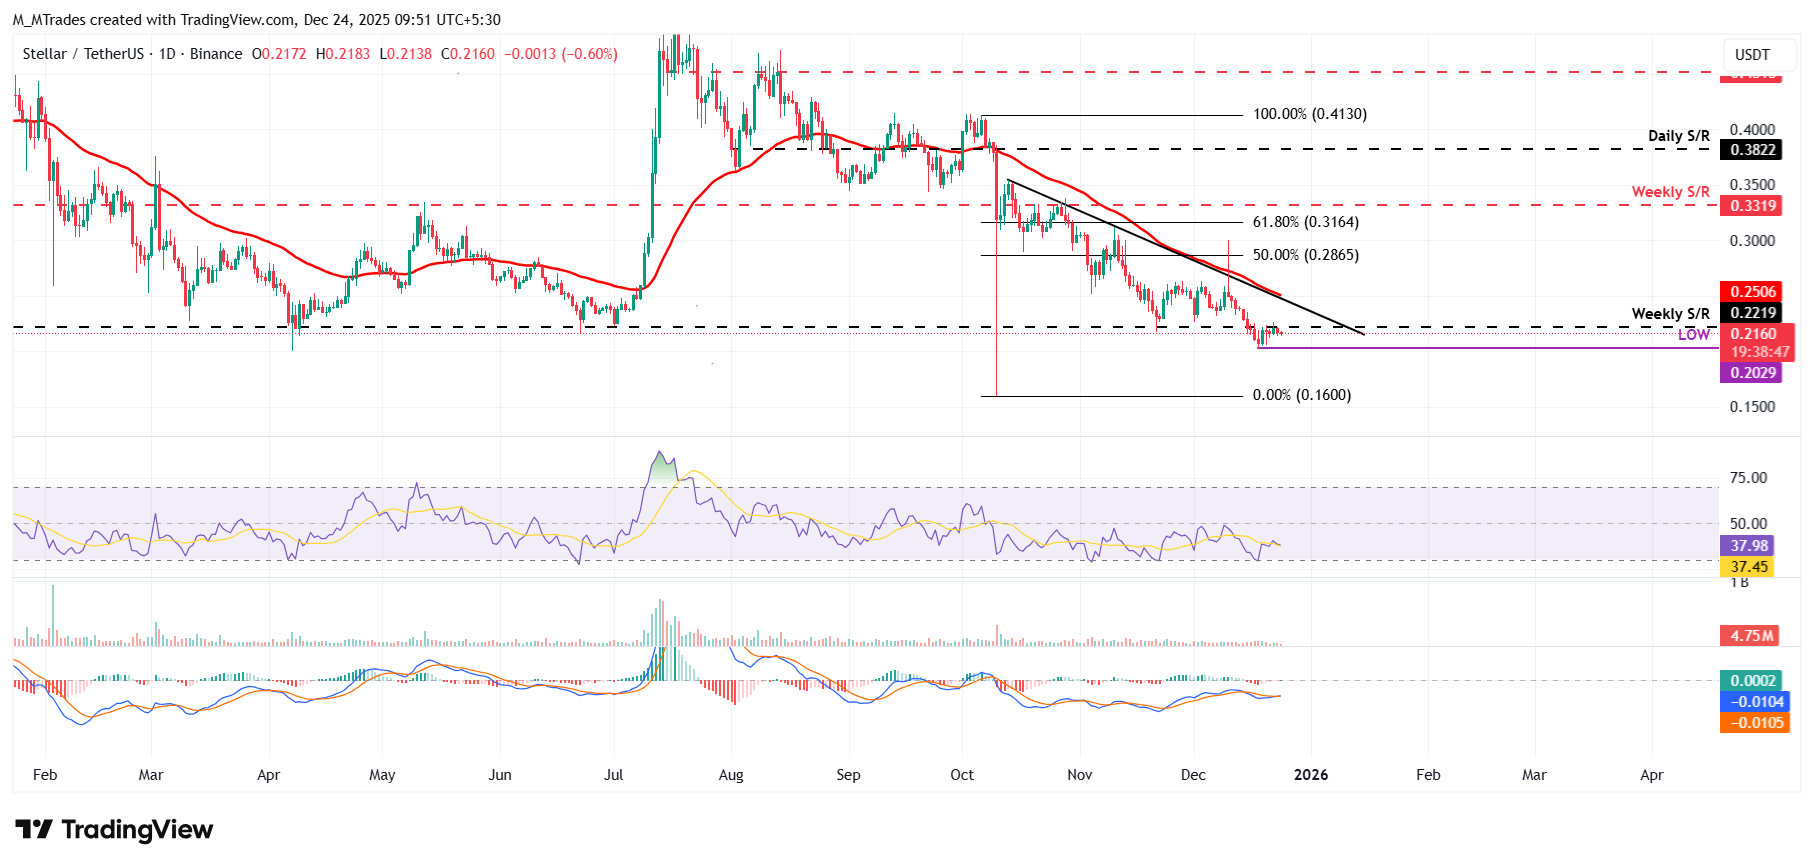
However, if XLM recovers, it could extend the advance toward the weekly resistance level at $0.22.

Acuity Trading 是一家成立於 2013 年、總部位於倫敦的金融科技公司,專注於 AI 驅動的另類數據與情緒分析,用於交易與投資。他們以可視化新聞與情緒工具革新線上交易體驗,並持續以最新 AI 研究與技術提供可產生阿爾法的另類數據與高度互動的交易工具。
閱讀更多


