
Trade The World
US Dollar Index Price Forecast: Drops to near 97.00 as bearish bias strengthens
作者 Akhtar Faruqui
發布日期: 16 Sep 2025 | 修改日期: 16 Sep 2025


POPULAR ARTICLES

The US Dollar Index (DXY), which measures the value of the US Dollar (USD) against six major currencies, is extending its losses for the second consecutive session and trading around 97.10 during the European hours on Tuesday.
- The US Dollar Index is likely to encounter initial support around the psychological 97.00 level.
- Bearish bias prevails as the 14-day Relative Strength Index remains below the 50 level.
- The initial barrier appears at the nine-day EMA of 97.57.
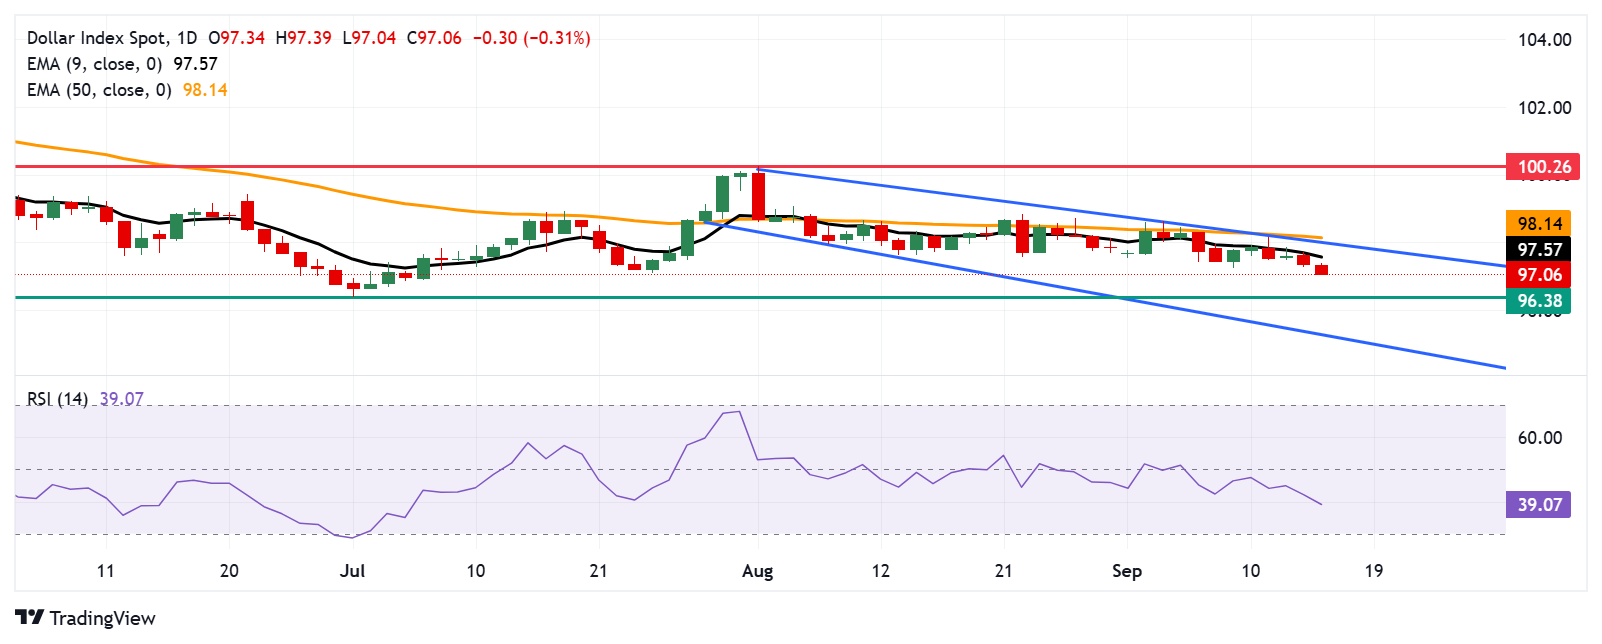
The US Dollar Index (DXY), which measures the value of the US Dollar (USD) against six major currencies, is extending its losses for the second consecutive session and trading around 97.10 during the European hours on Tuesday. The technical analysis of the daily chart shows the dollar index consolidating within the descending channel pattern, suggesting a prevailing bearish bias.
The 14-day Relative Strength Index (RSI) is positioned below the 50 level, strengthening the bearish bias. Additionally, the short-term price momentum is weaker as the DXY remains below the nine-day Exponential Moving Average (EMA).
On the downside, the US Dollar Index may find its immediate support at the psychological level of 97.00, followed by 96.38, the lowest since February 2022, reached on July 1. Further declines would prompt the dollar index to test the lower boundary of the descending channel around 95.30.
The DXY may find its primary barrier at the nine-day EMA of 97.57. A break above this level would improve the short-term price momentum and support the dollar index to approach the descending channel’s upper boundary around the psychological level of 98.00, aligned with the 50-day EMA at 98.14.
US Dollar Index: Daily Chart
US Dollar Price Today
The table below shows the percentage change of US Dollar (USD) against listed major currencies today. US Dollar was the weakest against the Swiss Franc.
| USD | EUR | GBP | JPY | CAD | AUD | NZD | CHF | |
|---|---|---|---|---|---|---|---|---|
| USD | -0.33% | -0.28% | -0.26% | -0.06% | -0.01% | 0.01% | -0.34% | |
| EUR | 0.33% | 0.05% | -0.03% | 0.27% | 0.38% | 0.33% | -0.00% | |
| GBP | 0.28% | -0.05% | -0.06% | 0.22% | 0.34% | 0.29% | -0.07% | |
| JPY | 0.26% | 0.03% | 0.06% | 0.27% | 0.33% | 0.10% | -0.03% | |
| CAD | 0.06% | -0.27% | -0.22% | -0.27% | 0.06% | 0.03% | -0.28% | |
| AUD | 0.00% | -0.38% | -0.34% | -0.33% | -0.06% | 0.04% | -0.38% | |
| NZD | -0.01% | -0.33% | -0.29% | -0.10% | -0.03% | -0.04% | -0.30% | |
| CHF | 0.34% | 0.00% | 0.07% | 0.03% | 0.28% | 0.38% | 0.30% |
The heat map shows percentage changes of major currencies against each other. The base currency is picked from the left column, while the quote currency is picked from the top row. For example, if you pick the US Dollar from the left column and move along the horizontal line to the Japanese Yen, the percentage change displayed in the box will represent USD (base)/JPY (quote).

Acuity Trading
Acuity Trading 是一家成立於 2013 年、總部位於倫敦的金融科技公司,專注於 AI 驅動的另類數據與情緒分析,用於交易與投資。他們以可視化新聞與情緒工具革新線上交易體驗,並持續以最新 AI 研究與技術提供可產生阿爾法的另類數據與高度互動的交易工具。
Read More


