
Trade The World
USD/CAD Price Forecast: Hovers around 1.4050 within overbought territory
作者 Akhtar Faruqui
發布日期: 17 Oct 2025 | 修改日期: 17 Oct 2025


POPULAR ARTICLES

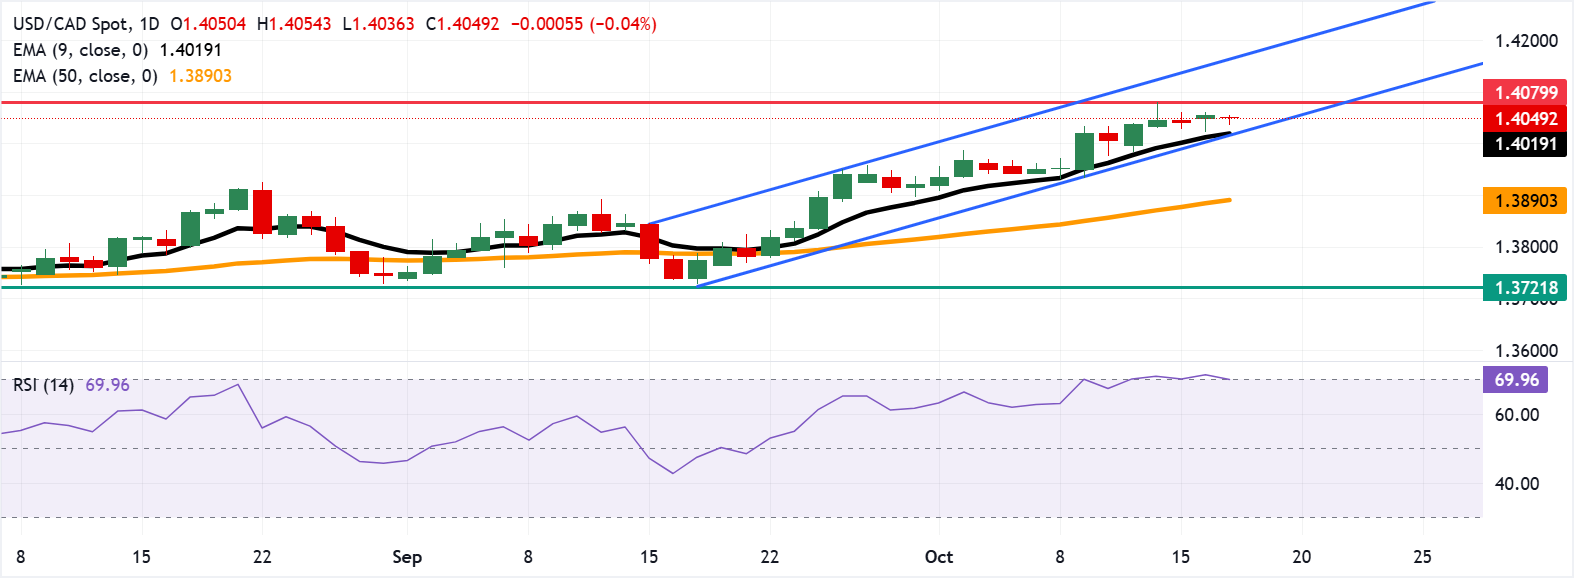
USD/CAD inches lower after registering gains in the previous session, trading around 1.4050 during the early European hours on Friday. The technical analysis of the daily chart suggests a persistent bullish bias as the pair is moving upwards within the ascending channel pattern.
- USD/CAD may target the six-month high of 1.4079.
- The 14-day Relative Strength Index hovers around 70, signaling overbought conditions.
- The primary support lies at the nine-day EMA of 1.4019.
USD/CAD inches lower after registering gains in the previous session, trading around 1.4050 during the early European hours on Friday. The technical analysis of the daily chart suggests a persistent bullish bias as the pair is moving upwards within the ascending channel pattern.
The short-term price momentum is stronger as the USD/CAD pair remains above the nine-day Exponential Moving Average (EMA). However, the 14-day Relative Strength Index (RSI) is positioned at the 70 level, suggesting the USD/CAD pair is trading within an overbought territory and a potential for a downward correction in the near future.
On the upside, the initial barrier lies at the six-month high of 1.4079, reached on October 14. A break above this level would support the pair to test the psychological level of 1.4100, followed by the ascending channel’s upper boundary around 1.4160.
The USD/CAD pair may find its initial support at the nine-day EMA of 1.4019, aligned with the lower boundary of the ascending channel. A break below this confluence support zone would weaken the short-term price momentum and put downward pressure on the pair to navigate the region around the 50-day EMA at 1.3890.
USD/CAD: Daily Chart
Canadian Dollar Price Today
The table below shows the percentage change of Canadian Dollar (CAD) against listed major currencies today. Canadian Dollar was the weakest against the Swiss Franc.
| USD | EUR | GBP | JPY | CAD | AUD | NZD | CHF | |
|---|---|---|---|---|---|---|---|---|
| USD | -0.19% | -0.14% | -0.51% | 0.00% | 0.22% | -0.14% | -0.54% | |
| EUR | 0.19% | 0.06% | -0.33% | 0.21% | 0.47% | 0.04% | -0.36% | |
| GBP | 0.14% | -0.06% | -0.34% | 0.11% | 0.39% | -0.02% | -0.48% | |
| JPY | 0.51% | 0.33% | 0.34% | 0.50% | 0.77% | 0.34% | -0.06% | |
| CAD | -0.00% | -0.21% | -0.11% | -0.50% | 0.23% | -0.16% | -0.60% | |
| AUD | -0.22% | -0.47% | -0.39% | -0.77% | -0.23% | -0.41% | -0.81% | |
| NZD | 0.14% | -0.04% | 0.02% | -0.34% | 0.16% | 0.41% | -0.46% | |
| CHF | 0.54% | 0.36% | 0.48% | 0.06% | 0.60% | 0.81% | 0.46% |
The heat map shows percentage changes of major currencies against each other. The base currency is picked from the left column, while the quote currency is picked from the top row. For example, if you pick the Canadian Dollar from the left column and move along the horizontal line to the US Dollar, the percentage change displayed in the box will represent CAD (base)/USD (quote).

Acuity Trading
Acuity Trading 是一家成立於 2013 年、總部位於倫敦的金融科技公司,專注於 AI 驅動的另類數據與情緒分析,用於交易與投資。他們以可視化新聞與情緒工具革新線上交易體驗,並持續以最新 AI 研究與技術提供可產生阿爾法的另類數據與高度互動的交易工具。
Read More


