
Iran War and Global Financial Markets in 2026: Oil, Inflation, Equities and the Global Economy
Key Takeaways
The Iran war has become a market event because it disrupted the most critical energy chokepoint and parts of the Gulf’s oil and LNG infrastructure.
Attacks and shutdowns have hit key facilities across Qatar, Saudi Arabia, Iraq, the UAE, Bahrain, and Iran itself, affecting ⅕ of the global oil supply.
The biggest immediate market effect is higher oil, higher inflation risk, and tighter financial conditions.
Europe, Japan, South Korea, Taiwan, India, and China are more exposed than the U.S. because they rely more on energy imports from the Middle East.
If the conflict cools, markets can rebound quickly. If energy disruption lasts, the downside for global equities, global GDP, and the broader global economy rises sharply.

How is the Iran war affecting global financial markets right now?
1. Oil is the first and most important channel
Oil is the center of the story because it is the fastest way the war reaches the world economy. Higher crude prices raise fuel, freight, electricity, fertilizer, and manufacturing costs, that would mean inflation being transferred to almost every product.
That is why this is not just an oil market issue. It is a global inflation issue. IMF Managing Director Kristalina Georgieva said that every sustained 10% increase in oil prices could add 0.4 percentage points to global inflation and cut worldwide output by as much as 0.2%.
2. Equities are repricing inflation and growth risk
Global equities swung sharply as markets struggle between two opposing forces: higher inflation from energy and weaker growth from tighter consumer and corporate finances.
The rebound after de escalation comments does not remove the risk
3. Bonds and rate cuts are under pressure
The war is complicating central bank policy because global central banks have been trying to stimulate growth after the most recent recession globally. With the Iran War, central banks struggle to introduce more rate hikes in the midst of rate cuts expectations.
This is why the current market fear is not just recession. It is stagflation.
4. The U.S. dollar is acting like the main safe haven
One of the clearest market reactions has been a stronger dollar. The dollar strengthened during the oil surge, while gold actually fell more than 1% because the stronger dollar and reduced rate cut expectations outweighed safe haven demand. That is important because it shows the market’s first instinct has been to seek dollar liquidity, not simply to buy every traditional safe haven.
A firmer dollar is worse for the global economy because it tightens financial conditions outside the U.S., especially in emerging markets that import energy and fund themselves in dollars.
5. The shock is spreading beyond oil
The Iran war is also affecting other parts of the global financial market through raw materials and trade. Aluminium hit a four year high on Middle East shipping concerns, while agricultural markets including palm oil, soybean oil, wheat, soybeans, and corn also spiked during the crude rally. AP reported that fertilizer flows through Hormuz are also at risk, which raises the risk of higher food prices and supply pressure in lower income countries.
This matters because the war is no longer just about energy imports. It is now feeding into broader global demand, industrial costs, and inflation expectations.
Which economies and markets are most exposed under Iran US War 2026?
The most direct hit falls on the Iranian economy and the Gulf region, but the wider financial market impact is most severe for energy importing economies.
Europe, Japan, South Korea, Taiwan, India, and China are more vulnerable because they rely more heavily on Middle Eastern oil and gas imports. Schwab highlighted Europe and Asia as the most exposed regions if disruption lasts. (Schwab News)
The U.S. is more buffered because it is now a major energy producer, but it is not insulated. Higher gasoline and diesel prices still hit consumers, inflation expectations, and election politics. Reuters reported U.S. average gasoline prices rose sharply over the week, and AP noted that higher energy prices could offset the benefit of recent tax refunds for many households if oil stays high.
There are also relative winners. AP said energy exporters outside the war zone, such as Canada, Norway, and Russia, can benefit from higher prices, while import dependent economies carry the bigger burden.
Iran War: Global Equity Market Forecast 2026
Technical Analysis
Price Action
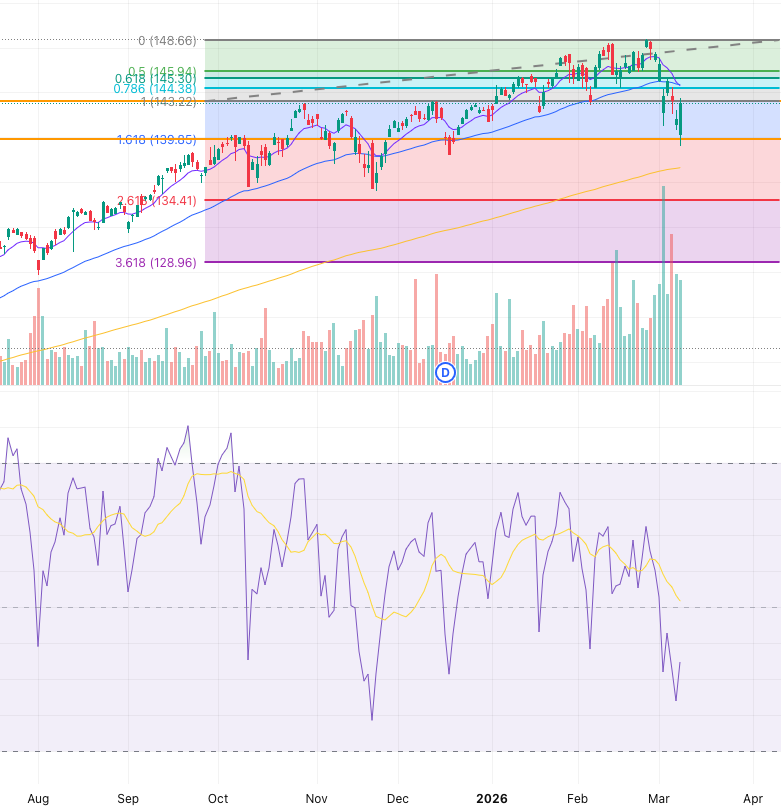
Price action of the latest candlesticks showed that ACWI (MSCI All Country World Index) is experiencing a strong support zone and buying momentum after reaching the $139 mark, printing a strong rebound price action via a major Engulfing Candlestick.
Support and Resistance
Both Weekly Support line (Orange Horizontal Line) and Fibonacci Retracement’s support coincide at $139 mark, further solidifying the support bias.
Indicators
RSI showed that it has gone into a strong oversold zone, where the most recent dip with similar depth, has immediately shown rebound.
Volume Analysis
Extremely strong buying momentum can be seen on March 03, printing the tallest volume bar on the chart, together with the several other volume bars, this shows a bullish outlook that MSCI ACWI has reached a strong regional support zone.
Technical Analysis Conclusion: The technical analysis shows a short term strong bull case for the Global Equity Market using the MSCI ACWI index.
Fundamental Analysis
Scenario 1: Quick de escalation
If geopolitical tension cools quickly and shipping risk improves, oil could retreat sharply, inflation fears would ease, and global equities could rebound.
Scenario 2: Gradual de-escalation
This is the middle ground. The war cools, but energy flows remain impaired for a while because damage, insurance, shipping, and restart delays take time to fix. In that case, oil can stay elevated, inflation remains sticky, and equity leadership stays with safer or less energy sensitive sectors.
Scenario 3: Prolonged disruption
This is the most worrying bear case for the global economy and global financial markets. If energy flows remain disrupted for months, oil could stay above $100, recession risk rises in Europe and Asia, central banks lose flexibility, and global equities face deeper and longer drawdowns.
Iran US War:Long Term Investors’ Outlook for 2026
The long term outlook depends less on the battlefield and more on whether global oil supply normalizes.
Oil Futures prices still suggest traders see this more as a short lived logistics shock than a permanent structural shortage, with near term backwardation deepening while much of the 2027 Brent strip remains below $70. That is an important signal. It means the market is still treating this as a front loaded crisis, not yet as a permanent reset for the global economy.
So the current verdict is this: the Iran war has already become a serious shock for the global financial market through oil, inflation, bonds, currencies, and equities.
The short term damage is severe.
The medium term damage depends on whether the disruption in Hormuz and regional energy infrastructure turns from a logistics crisis into a structural one.
Until that is clearer, the global financial market will continue to trade headline by headline, with global energy prices setting the tone for everything else.


