
Trade The World
1inch Price Forecast: 1INCH eyes breakout as bullish momentum builds
作者 Manish Chhetri
發布日期: 1 Oct 2025 | 修改日期: 1 Oct 2025


POPULAR ARTICLES

1inch (1INCH) price is trading within a falling wedge pattern on the daily chart around $0.257 at the time of writing on Wednesday. A breakout of this continuation pattern would favor long positions.
- 1inch price trades within a falling wedge pattern, a breakout signals a bullish move ahead.
- On-chain data shows accumulation by certain holders during recent dips alongside rising transaction volumes.
- The technical indicators suggest that bullish momentum is gaining traction, with investors betting on the asset price to rise.
1inch (1INCH) price is trading within a falling wedge pattern on the daily chart around $0.257 at the time of writing on Wednesday. A breakout of this continuation pattern would favor long positions. The bullish outlook is further supported by certain holders accumulating 1INCH tokens during recent dips, alongside rising transaction volumes. The technical indicators are also pointing to a potential breakout as upward momentum is gaining traction.
On-chain and derivatives data show bullish bias
Santiment’s Supply Distribution data supports a bullish outlook for 1INCH, as certain holders have accumulated during recent price dips.
The metric indicates that whales holding between 100,000 and 1 million (red line) and 1 million and 10 million 1INCH tokens (yellow line) have accumulated 10.27 million tokens from Tuesday to Wednesday. During the same period, wallets holding between 10 and 100 million (blue line) have shed 10.49 million tokens.
This shows that the second cohort of whales could have fallen prey to the capitulation event. In contrast, the first set of wallets seized the opportunity and accumulated 1INCH at a discount.
 [10-1759299285593-1759299285598.10.24, 01 Oct, 2025].png)
1INCH supply distribution chart. Source: Santiment
Another aspect bolstering the platform’s bullish outlook is a recent surge in traders’ interest and liquidity in the 1inch. Santiment data shows that 1INCH’s trading volume rose from $13.35 million on Tuesday to $64.04 million on Wednesday, the highest since August 20.
 [09-1759299309489-1759299309491.48.29, 01 Oct, 2025].png)
1inch trading volume chart. Source: Santiment
On the derivatives side, 1INCH bullish bets among traders are rising toward the monthly high. The CoinGlass chart below shows that the 1INCH long-to-short ratio stands at 1.08 on Wednesday, indicating that traders are betting on the asset’s price to rise.
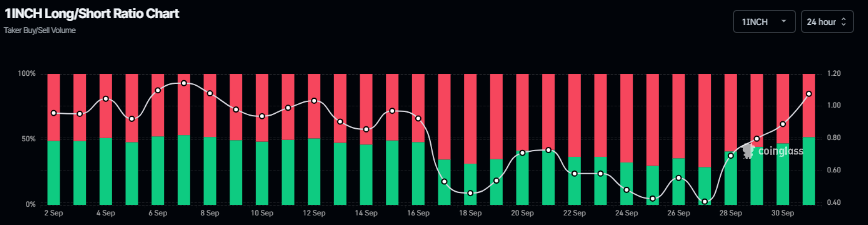
1INCH long-to-short ratio chart. Source: Coinglass
1INCH Price Forecast: 1INCH bulls aiming for a breakout
1inch price trades within a falling wedge pattern (formed by joining multiple highs and lows with two trendlines since early August). At the time of writing on Wednesday, 1INCH is trading at $0.257, nearing the upper trendline boundary.
If 1INCH breaks above the upper trendline, it could extend the rally by 20% from its current levels to retest the next daily resistance at $0.307.
The Relative Strength Index (RSI) on the daily chart reads 54, which is above its neutral level of 50, indicating that bullish momentum is gaining traction. Additionally, the Moving Average Convergence Divergence (MACD) is showing a bullish crossover on Wednesday, providing a buy signal and suggesting the start of an upward trend ahead.
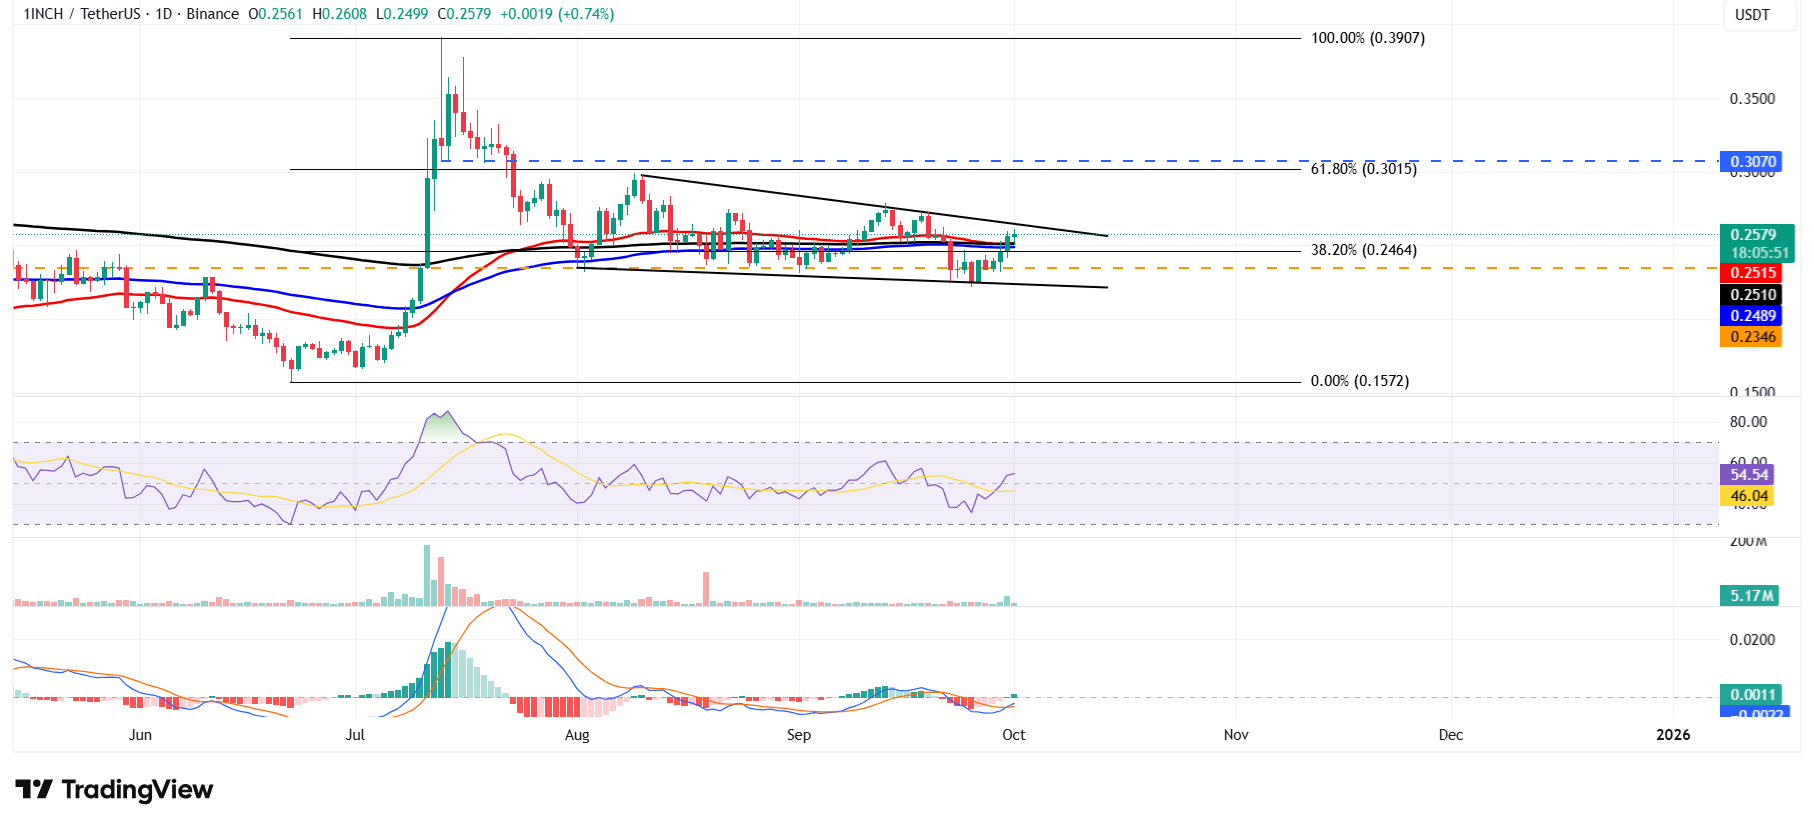
1INCH/USDT daily chart
However, if 1inch faces a correction, it could extend the decline to retest the weekly support level at $0.234.

FXStreet
超過一百萬用戶依賴 FXStreet 獲取即時市場數據、圖表工具、專家洞見與外匯新聞。其全面的經濟日曆與教育網路研討會協助交易者保持資訊領先、做出審慎決策。FXStreet 擁有約 60 人的團隊,分布於巴塞隆納總部及全球各地。
Read More


