
Trade The World
Aave Price Forecast: AAVE slips below $260 as on-chain metrics turn bearish
作者 Manish Chhetri
發布日期: 14 Oct 2025 | 修改日期: 14 Oct 2025


POPULAR ARTICLES

Aave (AAVE) price trade below $260 at the time of writing on Tuesday as the token faces weakness around its key resistance zone.
- Aave price trades in red on Tuesday, facing rejection near a key resistance zone.
- On-chain data shows declining TVL and lending capacity, falling to levels last seen in mid-August.
- The technical outlook signals a correction as selling pressure begins to build.
Aave (AAVE) price trade below $260 at the time of writing on Tuesday as the token faces weakness around its key resistance zone. On-chain indicators paint a bearish picture, with declining Total Value Locked (TVL) and lending capacity suggesting reduced network activity, while technical signals point toward a possible near-term correction.
On-chain data suggests a reduction in network activity
Arthemis Terminal data shows that Aave’s TVL fell from $39.9 billion on October 7 to $33.2 billion on Monday, reaching levels not seen since mid-August. Falling TVL indicates declining activity and waning interest within Aave’s ecosystem, suggesting that fewer users are depositing or utilizing assets within AAVE-based protocols.
-1760420497188-1760420497202.jpeg)
AAVE TVL chart. Source: Artemis
Additionally, AAVE’s lending loan capacity has also fallen from $65.6 billion on October 7 to $55.5 billion on Monday, reaching levels not seen since mid-August. This fall in lending capacity indicates less liquidity is available for borrowers, signaling reduced participation or declining confidence in the protocol.
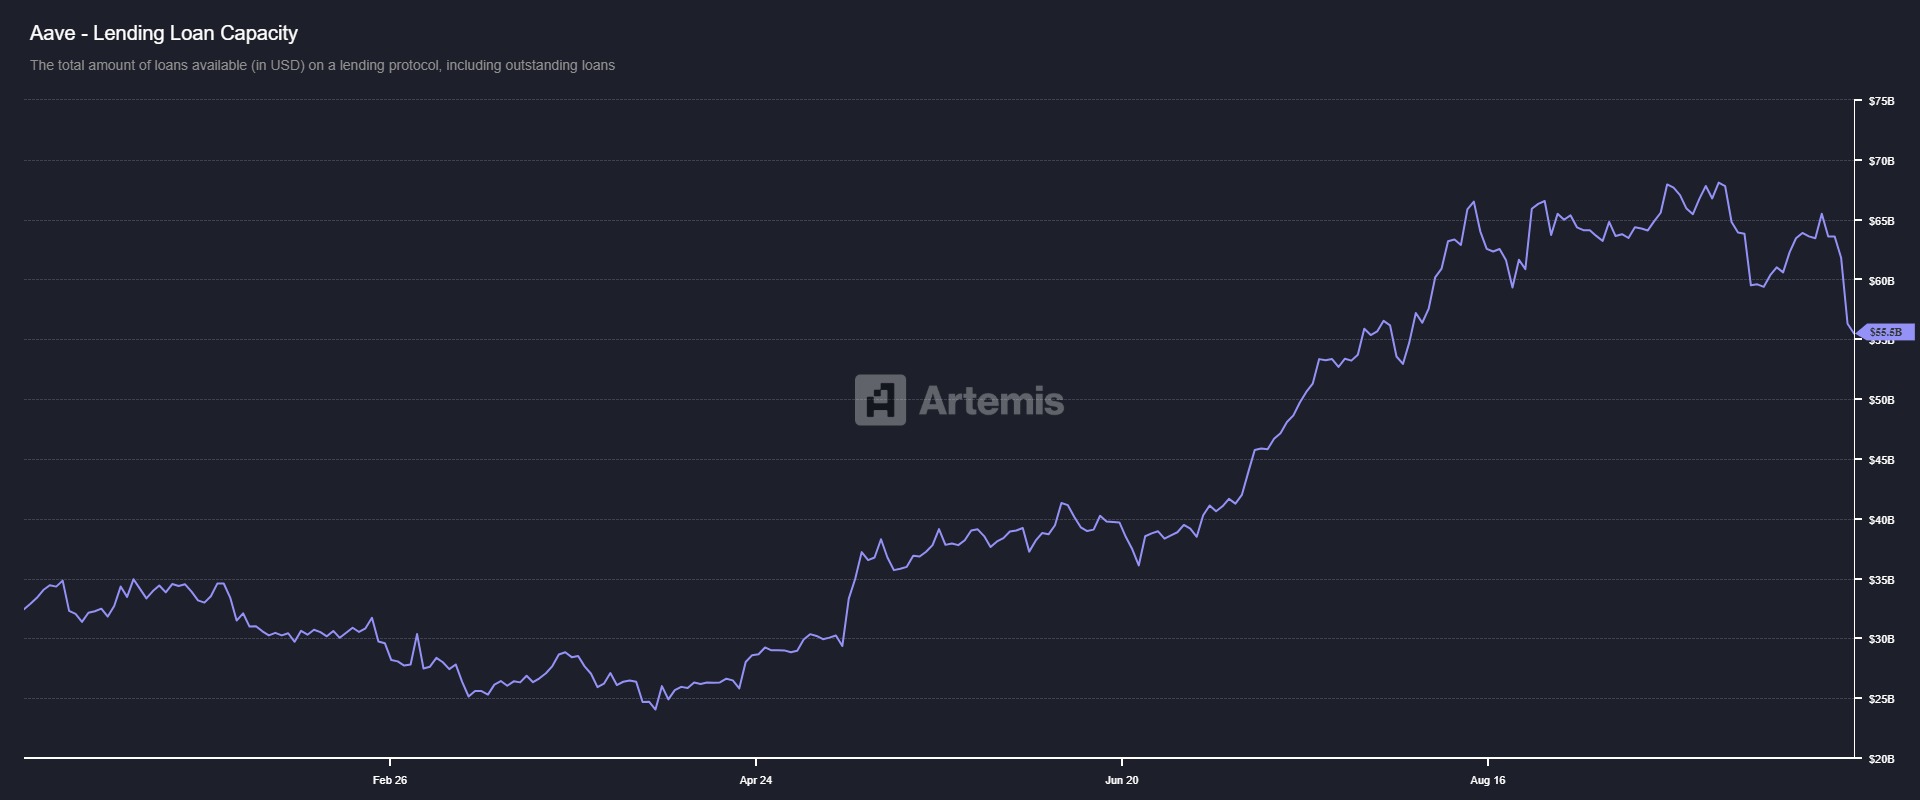
AAVE lending loan capacity chart. Source: Artemis
Aave Price Forecast: Bears in control of the momentum
Aave price broke below the ascending trendline on Friday and declined more than 18%, reaching a low of $79.51 that day. However, AAVE recovered by 16% in the next three days. At the time of writing on Tuesday, it trades down as it nears the previously broken trendline. This trendline roughly coincides with the 61.8% Fibonacci retracement level at $268.91, making this a key resistance zone.
If AAVE continues its correction, it could extend the decline toward the weekly support at $203.50.
The Relative Strength Index (RSI) on the daily chart reads 42, below its neutral level of 50, indicating the bears are in control of the momentum. Moreover, the Moving Average Convergence Divergence (MACD) indicator also showed a bearish crossover on Friday, which continues to support a bearish view.
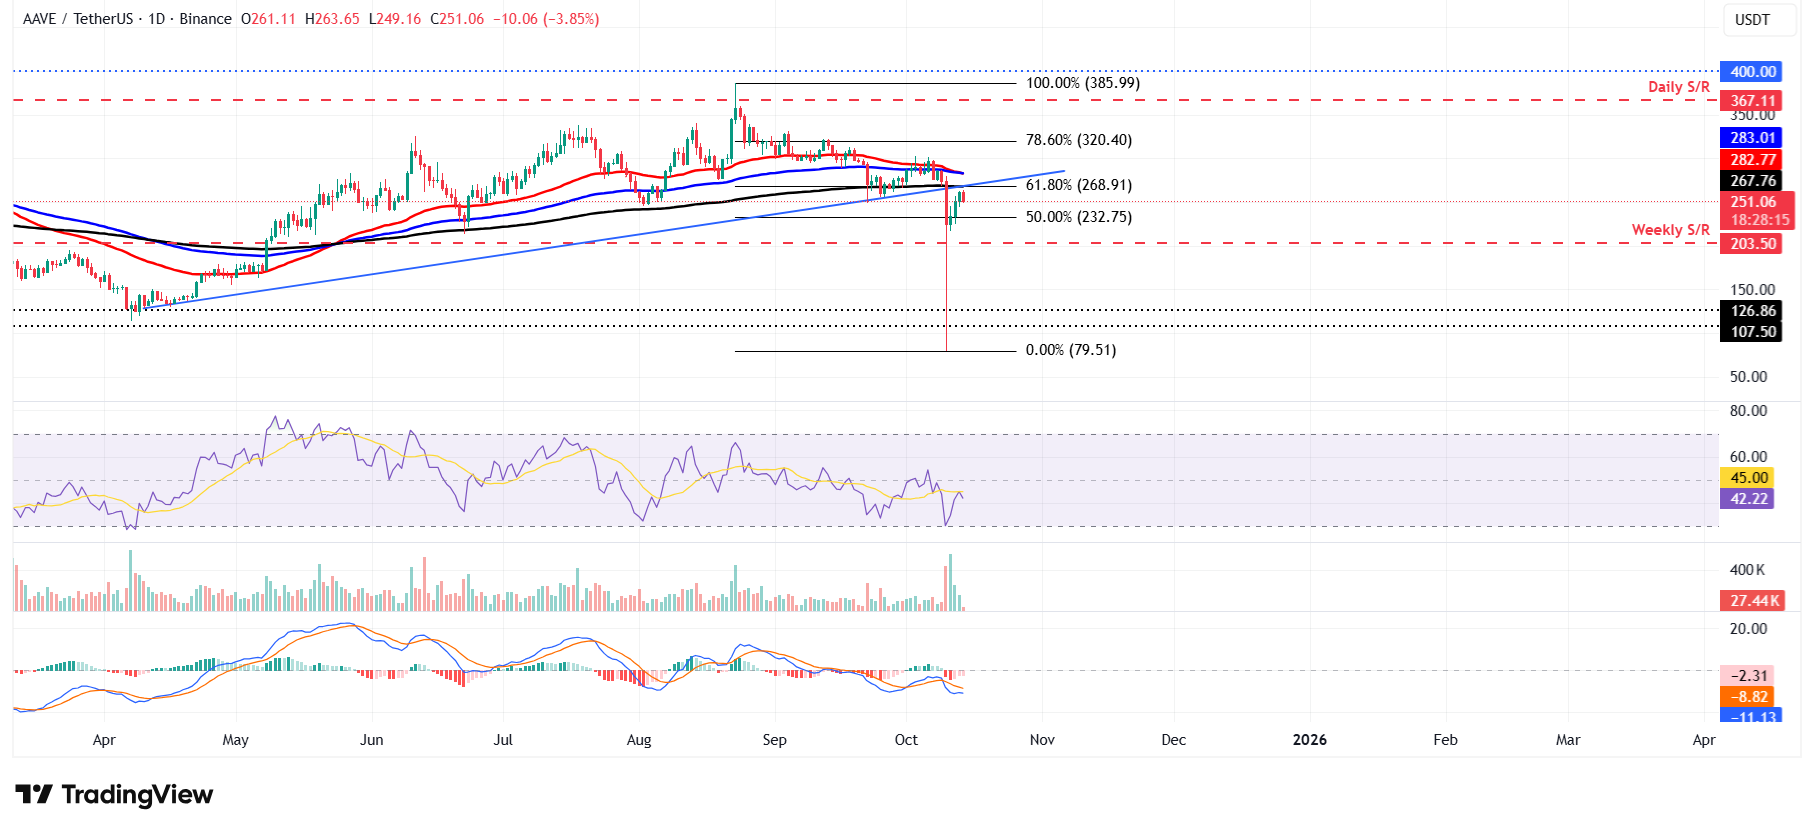
AAVE/USDT daily chart
However, if AAVE breaks and closes above the $268.91 level, it could extend the recovery toward the 100-day Exponential Moving Average (EMA) at $283.01.

FXStreet
超過一百萬用戶依賴 FXStreet 獲取即時市場數據、圖表工具、專家洞見與外匯新聞。其全面的經濟日曆與教育網路研討會協助交易者保持資訊領先、做出審慎決策。FXStreet 擁有約 60 人的團隊,分布於巴塞隆納總部及全球各地。
Read More


