
AUD/USD Price Forecast: Tests 0.7000 support as 14-day RSI suggests overbought conditions
作者 Akhtar Faruqui
發布日期: 30 Jan 2026 | 修改日期: 30 Jan 2026


熱門文章

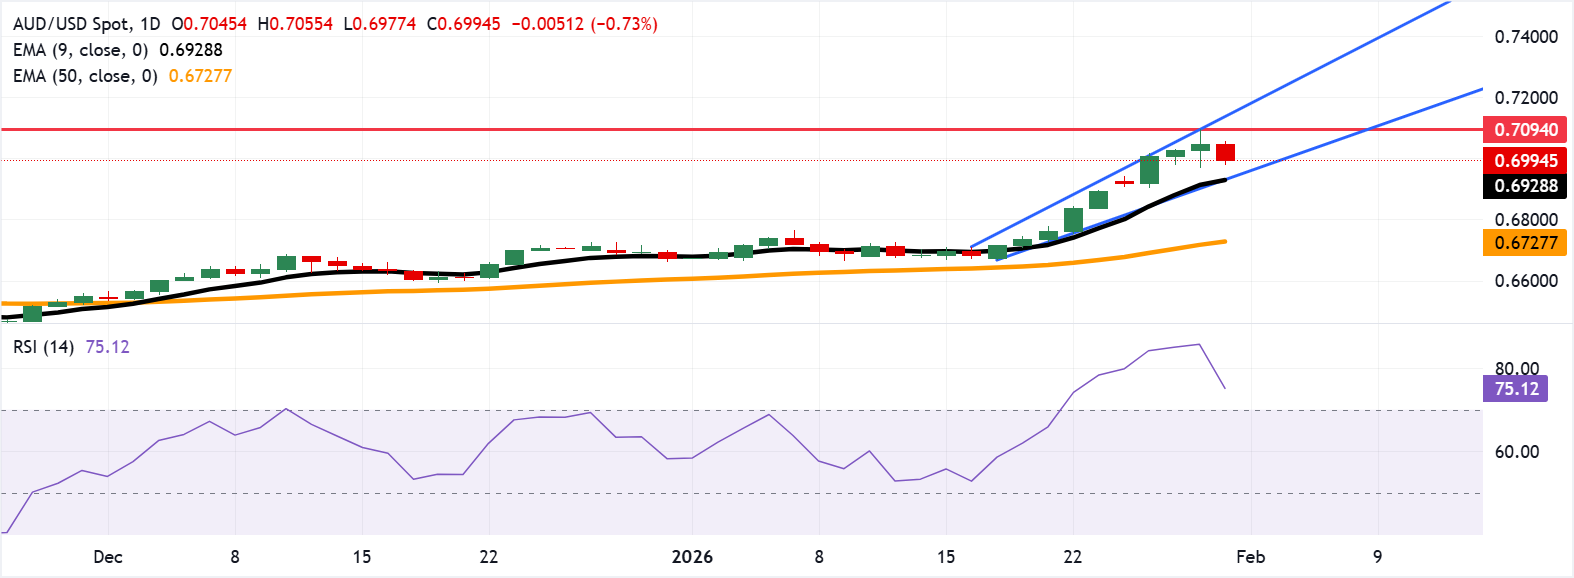
AUD/USD depreciates after three days of gains, trading around 0.7000 during the early European hours on Friday. Daily chart analysis indicates that the pair is remaining within the ascending channel pattern, indicating a persistent bullish bias.
- AUD/USD may test the 0.7094 barrier, the highest since February 2023.
- The 14-day Relative Strength Index is at 79, suggesting stretched momentum, limiting further gains.
- Primary support sits near the confluence at the lower ascending channel and nine-day EMA around 0.6931.
AUD/USD depreciates after three days of gains, trading around 0.7000 during the early European hours on Friday. Daily chart analysis indicates that the pair is remaining within the ascending channel pattern, indicating a persistent bullish bias.
The AUD/USD pair stands firmly above the rising nine-day Exponential Moving Average (EMA) and the 50-day EMA, underscoring a persistent bullish bias. The short-term average accelerates above the medium-term gauge, reinforcing positive momentum.
The 14-day Relative Strength Index (RSI) is at 76.86 (overbought), which could precede a pause or a shallow pullback. RSI has cooled from peak extremes but remains overbought, so momentum stays positive even as upside could slow.
The AUD/USD pair could test the 0.7094, the highest level since February 2023, which was recorded on January 29. Further advances would support the pair to test the upper boundary of the ascending channel around 0.7140.
On the downside, the primary support lies at confluence around the lower ascending channel boundary at the nine-day EMA of 0.6931. A break below the channel and the short-term average would cause the emergence of the bearish bias and put downward pressure on the AUD/USD pair to approach the 50-day EMA at 0.6728.
(The technical analysis of this story was written with the help of an AI tool.)
Australian Dollar Price Today
The table below shows the percentage change of Australian Dollar (AUD) against listed major currencies today. Australian Dollar was the weakest against the US Dollar.
| USD | EUR | GBP | JPY | CAD | AUD | NZD | CHF | |
|---|---|---|---|---|---|---|---|---|
| USD | 0.35% | 0.39% | 0.55% | 0.24% | 0.74% | 0.51% | 0.36% | |
| EUR | -0.35% | 0.05% | 0.20% | -0.11% | 0.40% | 0.17% | 0.01% | |
| GBP | -0.39% | -0.05% | 0.15% | -0.15% | 0.35% | 0.13% | -0.04% | |
| JPY | -0.55% | -0.20% | -0.15% | -0.30% | 0.20% | -0.05% | -0.19% | |
| CAD | -0.24% | 0.11% | 0.15% | 0.30% | 0.50% | 0.26% | 0.12% | |
| AUD | -0.74% | -0.40% | -0.35% | -0.20% | -0.50% | -0.23% | -0.39% | |
| NZD | -0.51% | -0.17% | -0.13% | 0.05% | -0.26% | 0.23% | -0.16% | |
| CHF | -0.36% | -0.01% | 0.04% | 0.19% | -0.12% | 0.39% | 0.16% |
The heat map shows percentage changes of major currencies against each other. The base currency is picked from the left column, while the quote currency is picked from the top row. For example, if you pick the Australian Dollar from the left column and move along the horizontal line to the US Dollar, the percentage change displayed in the box will represent AUD (base)/USD (quote).

超過一百萬用戶依賴 FXStreet 獲取即時市場數據、圖表工具、專家洞見與外匯新聞。其全面的經濟日曆與教育網路研討會協助交易者保持資訊領先、做出審慎決策。FXStreet 擁有約 60 人的團隊,分布於巴塞隆納總部及全球各地。
閱讀更多


