
Bitcoin Price Forecast: BTC faces rejection risk near $88,000 amid heavy ETF outflows
作者 Manish Chhetri
發布日期: 26 Jan 2026 | 修改日期: 26 Jan 2026


熱門文章

Bitcoin (BTC) price recovers slightly, trading near the previously broken midpoint of a horizontal parallel channel around $88,000 at the time of writing on Monday, after falling over 7% in the previous week.
- Bitcoin price struggles near the previously broken midpoint of a horizontal parallel channel at $87,787 on Monday.
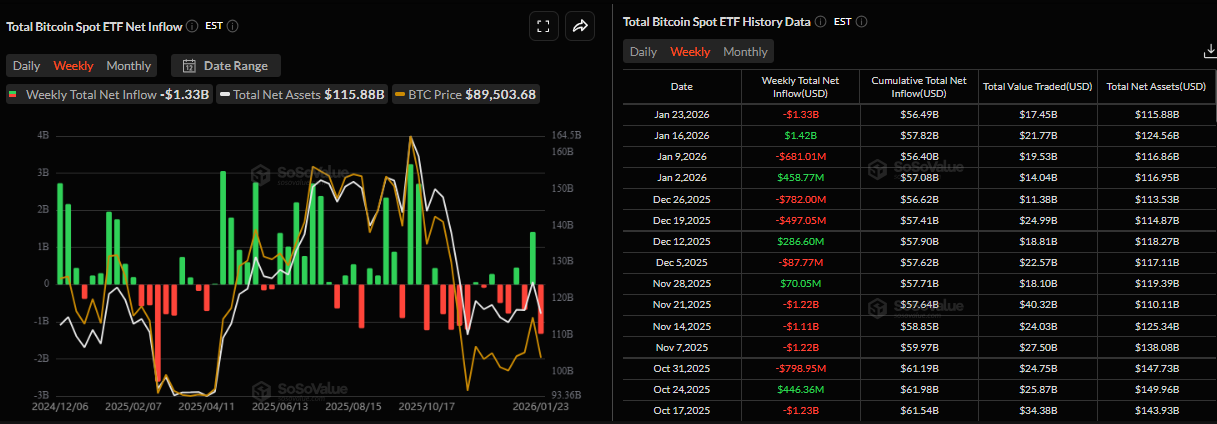
- US-listed spot ETFs recorded an outflow of $1.33 billion last week, the second-highest weekly withdrawals since their launch.
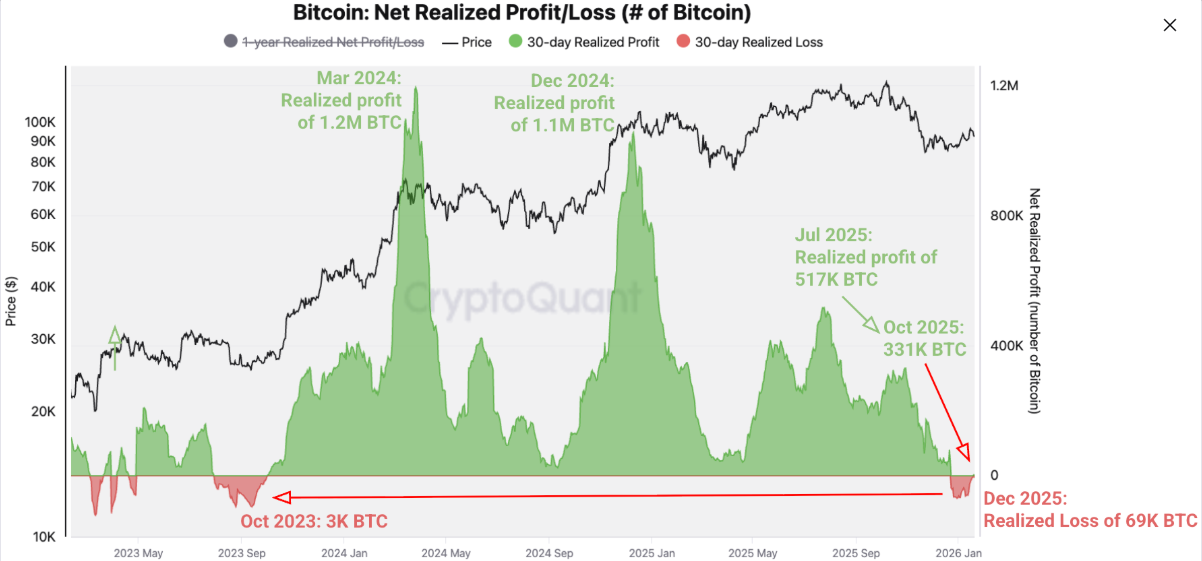
- Bitcoin’s profit dynamics have turned negative, marking a regime change from profit-taking to loss realization over the past 30 days, report suggests.
Bitcoin (BTC) price recovers slightly, trading near the previously broken midpoint of a horizontal parallel channel around $88,000 at the time of writing on Monday, after falling over 7% in the previous week. The bearish outlook strengthens as BTC spot Exchange Traded Funds (ETFs) recorded an outflow of over $1.3 billion, the second-highest weekly withdrawals since their launch. In addition, CryptoQuant report highlights that Crypto King’s profit dynamics have turned negative, suggesting weakness in the near term.
Institutional demand weakens, fueling price dips
Institutional demand for BTC weakened last week. According to SoSoValue data, spot Bitcoin Exchange Traded Funds (ETFs) recorded a total outflow of $1.33 billion in the previous week, the second-highest weekly outflow since their launch. If these outflows continue and intensify, BTC could see further correction.
The week ahead
QCP Capital reported on Monday that the crypto market traded in a narrow range over the weekend before coming under pressure during early Asian hours, triggering more than $550 millions in liquidations of leveraged long positions.
The analyst further explained that the risk-off move appears to have been catalyzed by a confluence of macro developments. These include US President Donald Trump’s comments on the potential imposition of 100% tariffs on Canadian imports, renewed concerns over a partial US government shutdown, and lingering uncertainty about the possibility of coordinated US-Japan intervention to stabilize the Yen.
“Looking ahead, implied volatility is likely to remain elevated amid a dense macro calendar. In addition to ongoing geopolitical and fiscal headlines, markets face major tech earnings and a Federal Reserve policy decision on Wednesday. While the Federal Reserve (Fed) is widely expected to hold rates steady, investors will be closely attuned to Jerome Powell’s guidance on the path of policy in the coming months. With multiple macro risks unresolved, crypto prices are likely to chop around in the near term, pending greater clarity, particularly around the risk of a US government shutdown,” concluded QCP Capital analyst.
Shift in regime
CryptoQuant’s weekly report highlighted a regime shift in Bitcoin’s market structure, as BTC profit dynamics have turned negative, signaling a transition from profit-taking to loss realization.
The chart below shows that Bitcoin holders began realizing net losses in December 2025 for the first time since October 2023. Since December 23 last year, holders have realized cumulative losses totaling approximately 69,000 BTC over the past 30 days. Moreover, realized profits peaks have been declining since March 2024, an indication that prices are losing momentum as the bull market ends.
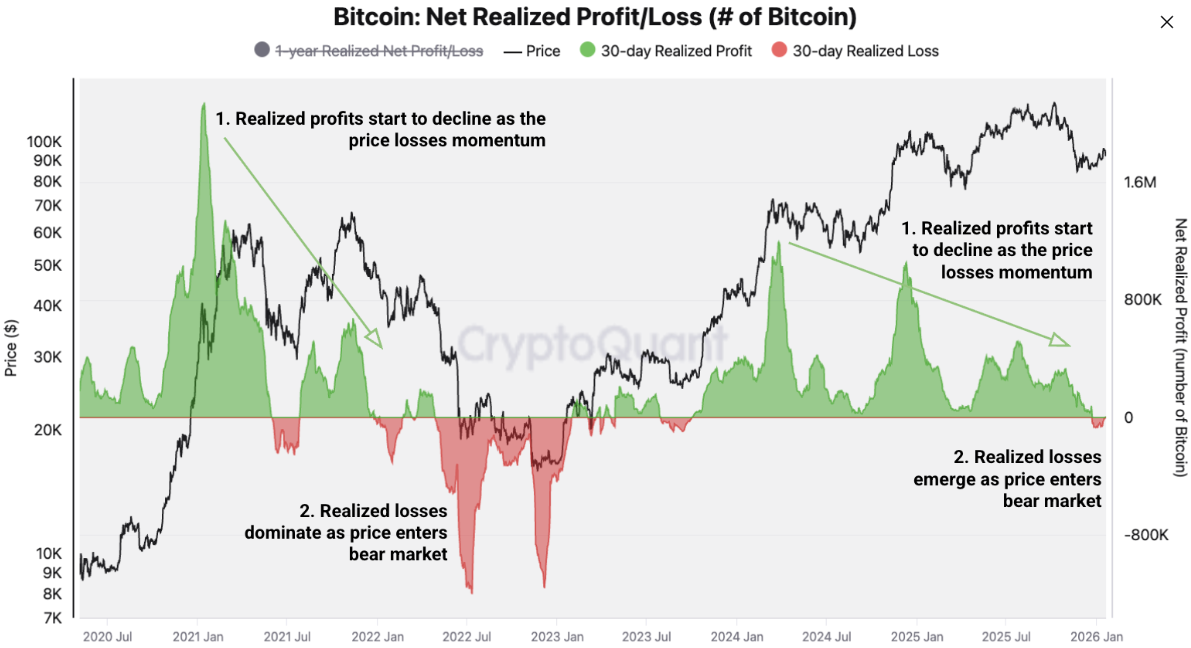
The current pattern closely mirrors that one of the 2021–2022 bull-to-bear transition, when realized profits peaked in January 2021, formed lower highs through 2021, and then turned into net losses ahead of the 2022 bear market.
Bitcoin Price Forecast: BTC momentum indicators show bearish signs
Bitcoin price closed below the midpoint of a horizontal parallel channel at $87,787 on Sunday, following a 7.4% correction last week. At the time of writing on Monday, BTC recovers slightly, nearing this broken level.
If BTC fails to close above the $87,787, it could extend the fall toward the lower consolidation boundary at $85,569, which coincides with the 78.6% Fibonacci retracement level.
The Relative Strength Index (RSI) on the daily chart is 40, below the neutral 50 level, indicating bearish momentum gaining traction. Traders should remain cautious, as the Moving Average Convergence Divergence (MACD) also showed a bearish crossover last week and has remained intact, suggesting a downward move.
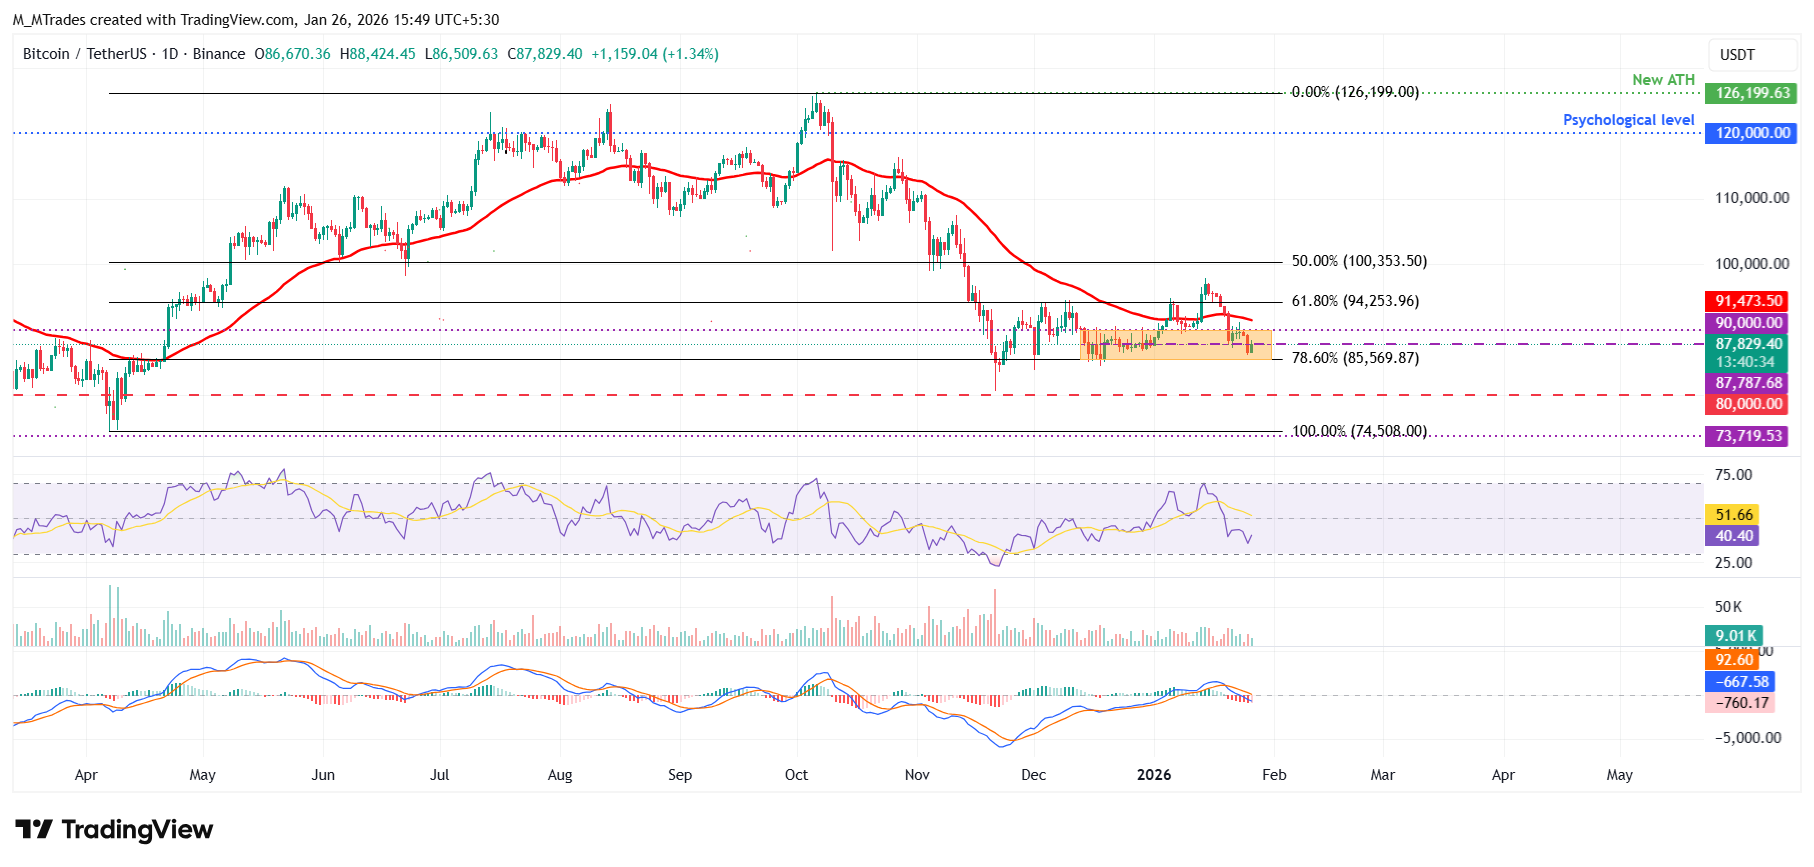
On the other hand, if BTC breaks and closes above $87,787 on a daily basis, it could extend the recovery toward the upper boundary of the horizontal pattern at $90,000.
Bitcoin, altcoins, stablecoins FAQs
Bitcoin is the largest cryptocurrency by market capitalization, a virtual currency designed to serve as money. This form of payment cannot be controlled by any one person, group, or entity, which eliminates the need for third-party participation during financial transactions.
Altcoins are any cryptocurrency apart from Bitcoin, but some also regard Ethereum as a non-altcoin because it is from these two cryptocurrencies that forking happens. If this is true, then Litecoin is the first altcoin, forked from the Bitcoin protocol and, therefore, an “improved” version of it.
Stablecoins are cryptocurrencies designed to have a stable price, with their value backed by a reserve of the asset it represents. To achieve this, the value of any one stablecoin is pegged to a commodity or financial instrument, such as the US Dollar (USD), with its supply regulated by an algorithm or demand. The main goal of stablecoins is to provide an on/off-ramp for investors willing to trade and invest in cryptocurrencies. Stablecoins also allow investors to store value since cryptocurrencies, in general, are subject to volatility.
Bitcoin dominance is the ratio of Bitcoin's market capitalization to the total market capitalization of all cryptocurrencies combined. It provides a clear picture of Bitcoin’s interest among investors. A high BTC dominance typically happens before and during a bull run, in which investors resort to investing in relatively stable and high market capitalization cryptocurrency like Bitcoin. A drop in BTC dominance usually means that investors are moving their capital and/or profits to altcoins in a quest for higher returns, which usually triggers an explosion of altcoin rallies.

超過一百萬用戶依賴 FXStreet 獲取即時市場數據、圖表工具、專家洞見與外匯新聞。其全面的經濟日曆與教育網路研討會協助交易者保持資訊領先、做出審慎決策。FXStreet 擁有約 60 人的團隊,分布於巴塞隆納總部及全球各地。
閱讀更多


