
Bitcoin Price Forecast: BTC holds gains amid US-Iran peace talks optimism
作者 Manish Chhetri
更新: 14 Apr 2026


熱門文章

Bitcoin (BTC) price holds gains trading above $74,500 on Tuesday after a key technical breakout the previous day.
- Bitcoin price steadies around $74,500 on Tuesday after rebounding 5.2% from the 50-day EMA the previous day.
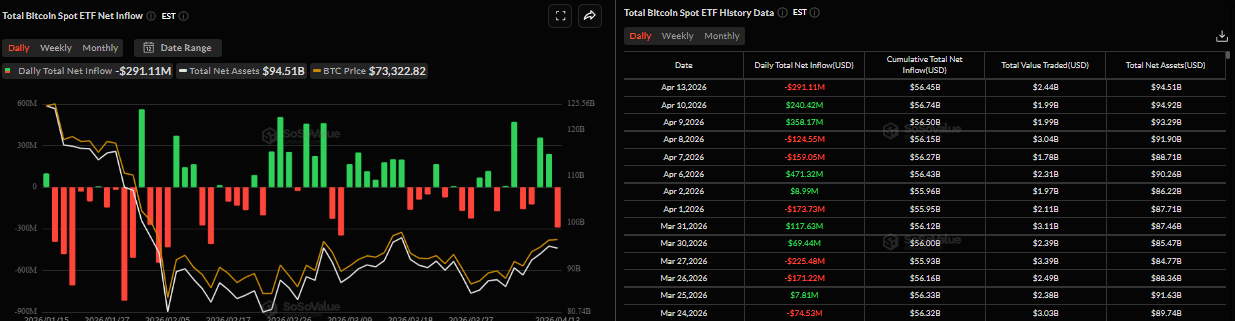
- US-listed spot Bitcoin ETFs recorded over $290 million in outflows, while Strategy added 13,927 BTC on Monday.
- Risk appetite improves as reports suggest the US and Iran may return to Islamabad this week for renewed peace talks.
Bitcoin (BTC) price holds gains trading above $74,500 on Tuesday after a key technical breakout the previous day. Improving risk appetite, driven by renewed hopes of US-Iran diplomatic progress, has added tailwinds to the Crypto King and the broader crypto market, placing BTC on track to challenge new highs if momentum persists.
Risk-on moods support Bitcoin
Bitcoin kicked off the week on a positive note, extending its previous week’s gains and closing at $74,417 on Monday. The recovery gained traction as geopolitical developments lifted market sentiment.
On Monday, Donald Trump stated during a press conference that Iran is eager to strike a deal “very badly,” even as he confirmed that the US Navy has initiated a blockade of Iranian ports following the collapse of recent peace talks.
Later on Tuesday, Reuters reported that negotiating teams from the US and Iran could return to Islamabad this week after failing to get a breakthrough in the first round of talks.
This development boosted risk appetite among market participants, with US and Asian equity markets extending their gains. At the same time, risky assets such as Bitcoin continued to rise, trading above $74,500 as of writing on Tuesday.
Institutional demand remains muted while Strategy adds $1 billion worth of Bitcoin
Institutional demand shows signs of hesitation this week, reflecting a cautious stance despite recent price strength. SoSoValue data shows that Bitcoin spot Exchange Traded Funds (ETFs) recorded an outflow of $291.11 million on Monday, after inflows of $786.31 million the previous week. If these outflows continue or intensify, it would cap Bitcoin’s ongoing price rally; however, if inflows occur, it would reinforce bullish momentum and potentially support further upside in BTC.
On the corporate side, Michael Saylor announced on X on Monday that his firm, Strategy (MSTR), had purchased 13,927 BTC for $1 billion, bringing its total holdings to 780,897 BTC. This highlights its continued aggressive accumulation strategy, while the firm’s average purchase price for all its holdings is $75,577, inches away from current market prices.
Bitcoin Price Forecast: Bullish technical breakout
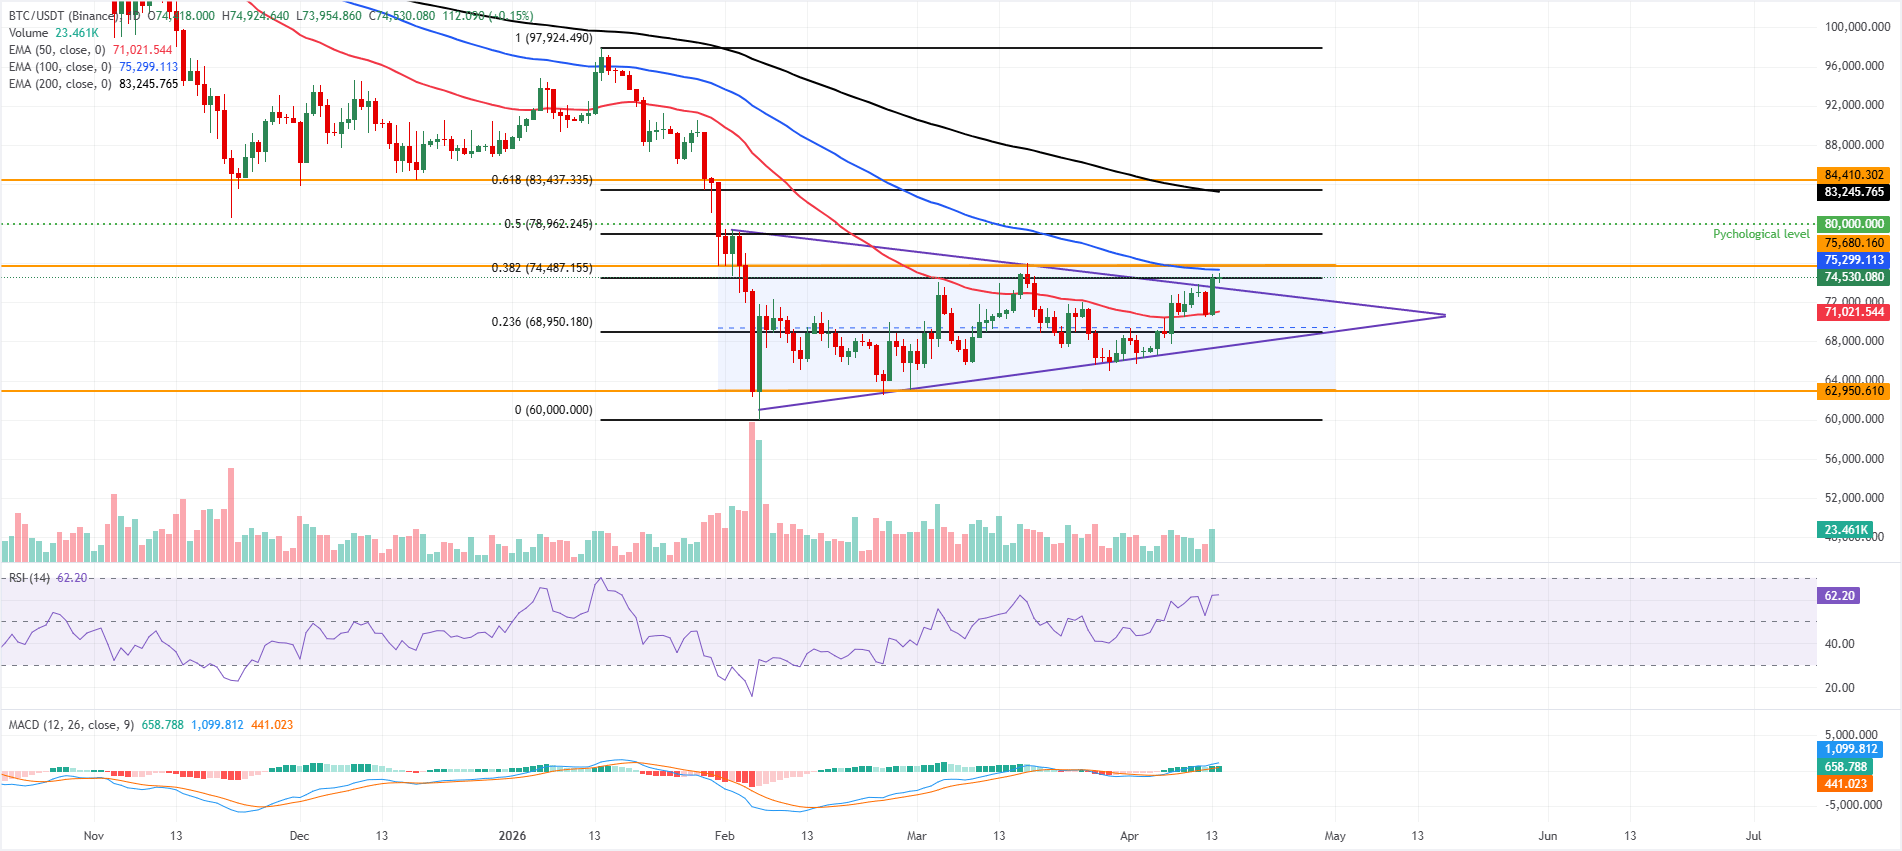
Bitcoin price is trading above $74,500 on Tuesday after breaking above the upper boundary of an ascending triangle pattern (drawn by connecting highs and lows with two trendlines since early February) the previous day. BTC price action is maintaining a bullish near-term bias, holding above the 50-day Exponential Moving Average (EMA) at $71,021.
The price is also hovering just over the 38.2% Fibonacci retracement, drawn from the January 14 high to the February 6 low, at $74,487, turning that retracement into an immediate demand area, while a rising Relative Strength Index (RSI) on the daily chart near 62 and a positive, expanding Moving Average Convergence Divergence (MACD) histogram both suggest that upside momentum remains constructive.
On the topside, initial resistance emerges at the 100-day EMA around $75,300, followed closely by a horizontal barrier near 75,680, with further hurdles at the 50% retracement at $78,962 and the psychological $80,000 level. Above these, the 200-day EMA at $83,245, the 61.8% Fibonacci retracement at $83,437, and a higher horizontal cap near $84,410 define a broader supply zone.
On the downside, immediate support is seen at the 38.2% Fibonacci retracement at $74,487, ahead of the 50-day EMA at 71,021; a deeper pullback would expose the 23.6% Fibonacci retracement at $68,950, the rising trendline support (triangle pattern) near $67,412, and ultimately the more distant horizontal floor around $62,950.
(The technical analysis of this story was written with the help of an AI tool.)
Bitcoin, altcoins, stablecoins FAQs
Bitcoin is the largest cryptocurrency by market capitalization, a virtual currency designed to serve as money. This form of payment cannot be controlled by any one person, group, or entity, which eliminates the need for third-party participation during financial transactions.
Altcoins are any cryptocurrency apart from Bitcoin, but some also regard Ethereum as a non-altcoin because it is from these two cryptocurrencies that forking happens. If this is true, then Litecoin is the first altcoin, forked from the Bitcoin protocol and, therefore, an “improved” version of it.
Stablecoins are cryptocurrencies designed to have a stable price, with their value backed by a reserve of the asset it represents. To achieve this, the value of any one stablecoin is pegged to a commodity or financial instrument, such as the US Dollar (USD), with its supply regulated by an algorithm or demand. The main goal of stablecoins is to provide an on/off-ramp for investors willing to trade and invest in cryptocurrencies. Stablecoins also allow investors to store value since cryptocurrencies, in general, are subject to volatility.
Bitcoin dominance is the ratio of Bitcoin's market capitalization to the total market capitalization of all cryptocurrencies combined. It provides a clear picture of Bitcoin’s interest among investors. A high BTC dominance typically happens before and during a bull run, in which investors resort to investing in relatively stable and high market capitalization cryptocurrency like Bitcoin. A drop in BTC dominance usually means that investors are moving their capital and/or profits to altcoins in a quest for higher returns, which usually triggers an explosion of altcoin rallies.

超過一百萬用戶依賴 FXStreet 獲取即時市場數據、圖表工具、專家洞見與外匯新聞。其全面的經濟日曆與教育網路研討會協助交易者保持資訊領先、做出審慎決策。FXStreet 擁有約 60 人的團隊,分布於巴塞隆納總部及全球各地。
閱讀更多


