
Bitcoin Weekly Forecast: BTC hits 20-month low, will the pain continue?
作者 Manish Chhetri
更新: 26 Jun 2026


熱門文章

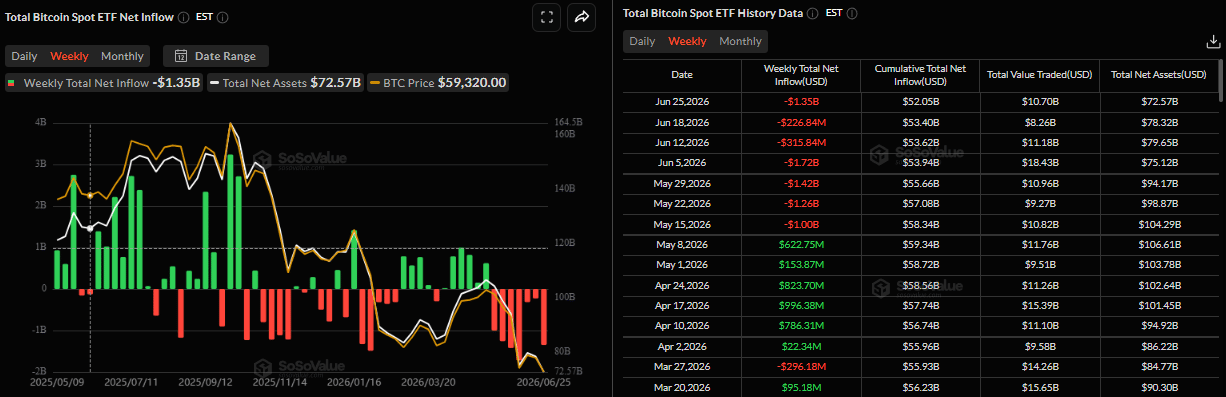
Bitcoin (BTC) recovers slightly, trading at $66,000 on Friday after reaching a new yearly low of $58,115 earlier this week, its lowest level since October 2024. Institutional selling intensified as spot Exchange Traded Funds (ETFs) recorded $1.35 billion in net outflows through Thursday.
- Bitcoin slips 5% so far this week, reaching a new yearly low of $58,115 and the lowest level since October 2024.
- US-listed spot ETFs recorded outflows of $1.35 billion through Thursday, pointing to the seventh consecutive week of withdrawals.
- Geopolitical uncertainty and a hawkish Fed continue to cap risk sentiment, weighing on BTC.
Bitcoin (BTC) recovers slightly, trading at $66,000 on Friday after reaching a new yearly low of $58,115 earlier this week, its lowest level since October 2024. Institutional selling intensified as spot Exchange Traded Funds (ETFs) recorded $1.35 billion in net outflows through Thursday. In addition, persistent geopolitical uncertainty and the Federal Reserve’s (Fed) hawkish stance continue to dampen risk appetite, keeping the Crypto King under pressure.
Middle East tensions pressure BTC
Bitcoin has remained under pressure this week, losing over 5% as traders assess mixed signals from different parties involved in the Middle East conflict.
The week began with mild progress in the US-Iran peace negotiations, initially improving market sentiment. However, in the latter half, news came in that Iran’s Islamic Revolutionary Guard Corps (IRGC) attacked a Singapore-flagged cargo ship in the Strait of Hormuz, reigniting worries about the sustainability of the preliminary US-Iran peace deal.
Meanwhile, the ongoing tensions involving Israel and Lebanon have kept geopolitical uncertainty elevated. Israel continues to attack southern Lebanon as Prime Minister Benjamin Netanyahu says the Israeli military is “not going to withdraw” from occupied areas.
These developments have kept uncertainty high, weighing on risk-sensitive assets such as Bitcoin, which has remained under pressure, reaching a new yearly low of $58,115 this week.
Macroeconomic headwinds continue to cap BTC
On the macroeconomic front, bets on a Fed rate hike continue to put a lid on risky assets.
The US Personal Consumption Expenditures (PCE) data released on Thursday accelerated to 4.1% YoY in May from the previous 3.8%. Moreover, the core gauge, which excludes volatile food and energy prices, rose 3.4% during the same period from 3.3% in April.
Investors believed that inflation likely peaked last month or is close to doing so in the face of the recent fall in Crude Oil prices to pre-war levels following an interim US-Iran peace deal. However, the improvement in the inflation outlook has done little to support Bitcoin, which extended its decline this week.
According to CME Group’s FedWatch Tool, market participants are still pricing in over an 60% chance that the US central bank will raise borrowing costs by September, which continues to provide support for the US Dollar and limits demand for risk-sensitive assets.
The bets were reaffirmed by comments from Chicago Fed President Austan Goolsbee that underlying inflation pressures are still too high and trending in the wrong way. Moreover, New York Fed President John Williams pushed back his expectation of getting inflation back to the 2% target and said that inflation remains too high, though it is likely to moderate this year.
In addition, a broader sell-off in global technology stocks earlier this week has further dampened investor sentiment, weighing on BTC.
Sell-off intensifies
Institutional demand continued to weaken so far this week. SoSoValue data shows that spot BTC ETFs recorded an outflow of $1.35 billion up to Thursday. Unless Friday’s inflows are very significant, BTC is about to mark the seventh week of steady withdrawals. This signals that institutional demand continues to weaken and fails to provide a cushion against falling BTC prices.
As explained in last week’s report, BTC staged a tentative relief bounce in the second week of June from deeply oversold levels. The rebound appears to have been driven largely by seller exhaustion rather than a meaningful recovery in investor demand, suggesting the rally may lack a solid foundation. This week’s sharp sell-off has confirmed this thesis, with sellers regaining firm control and reinforcing the prevailing bearish trend.
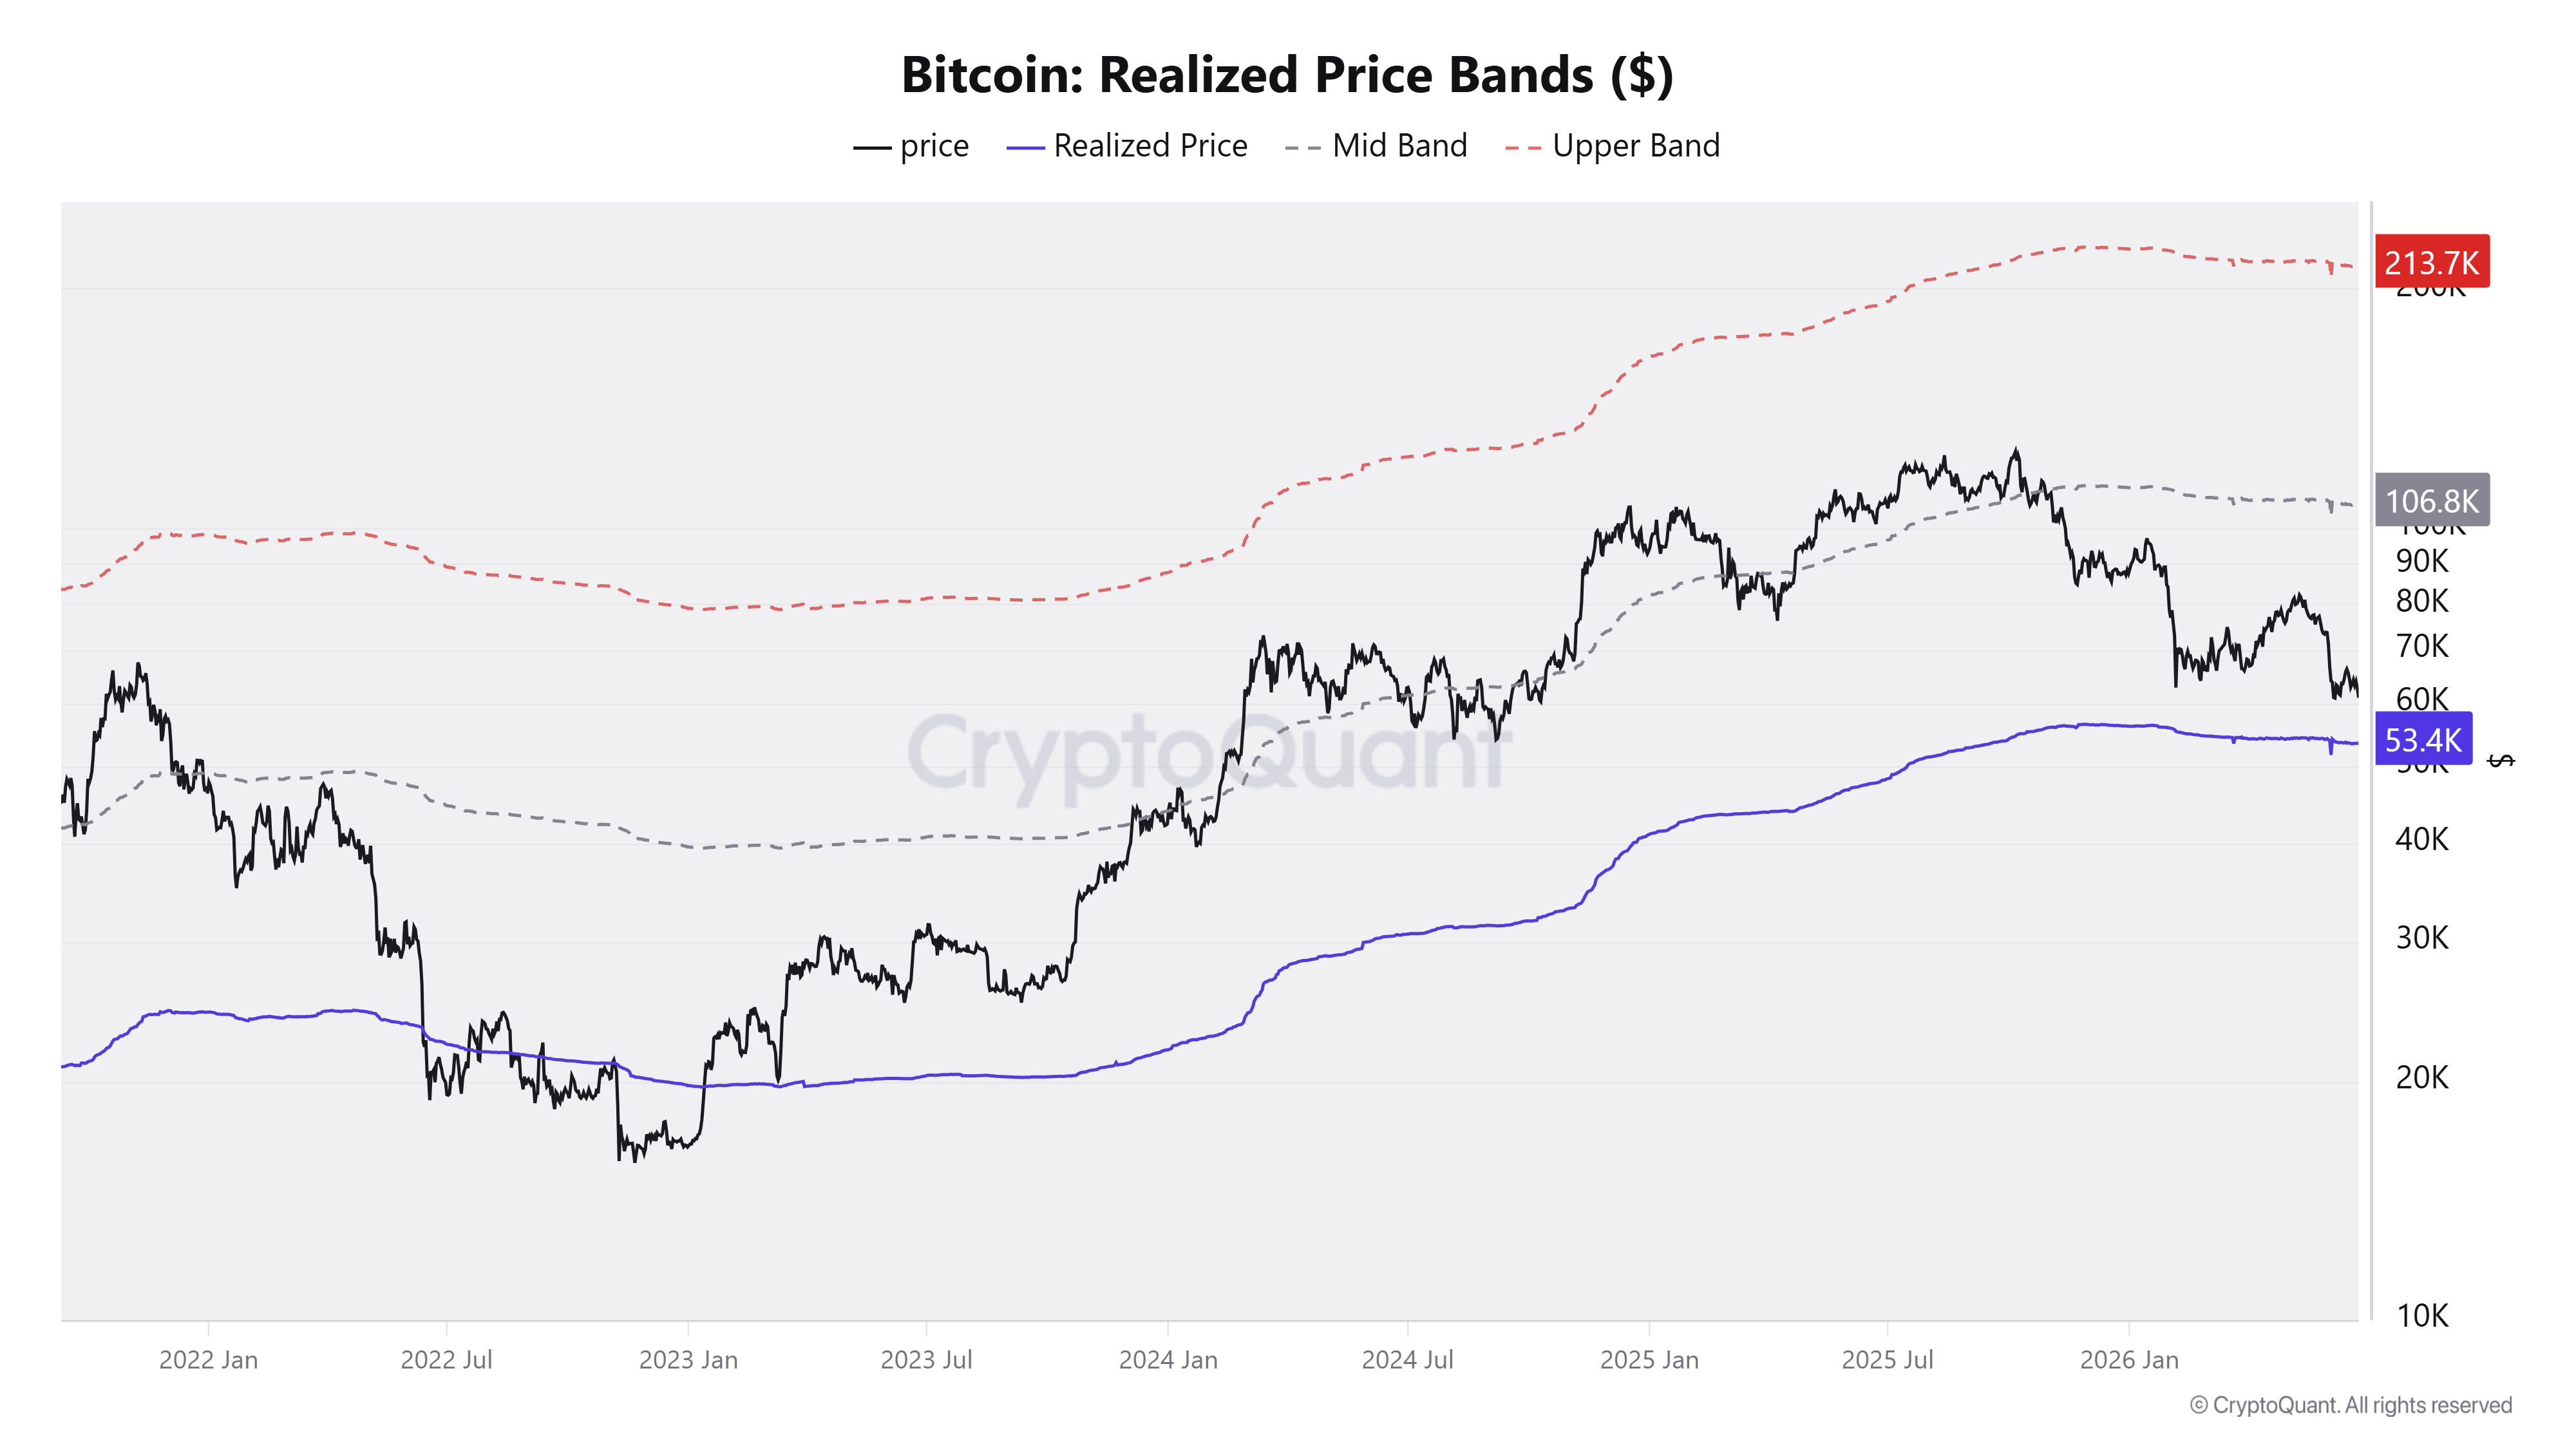
Unless fresh buying interest emerges, BTC could extend its ongoing correction toward $53,400, a level that has historically marked bear-market bottoms in previous cycles.
Technical outlook: Where is BTC’s next stop?
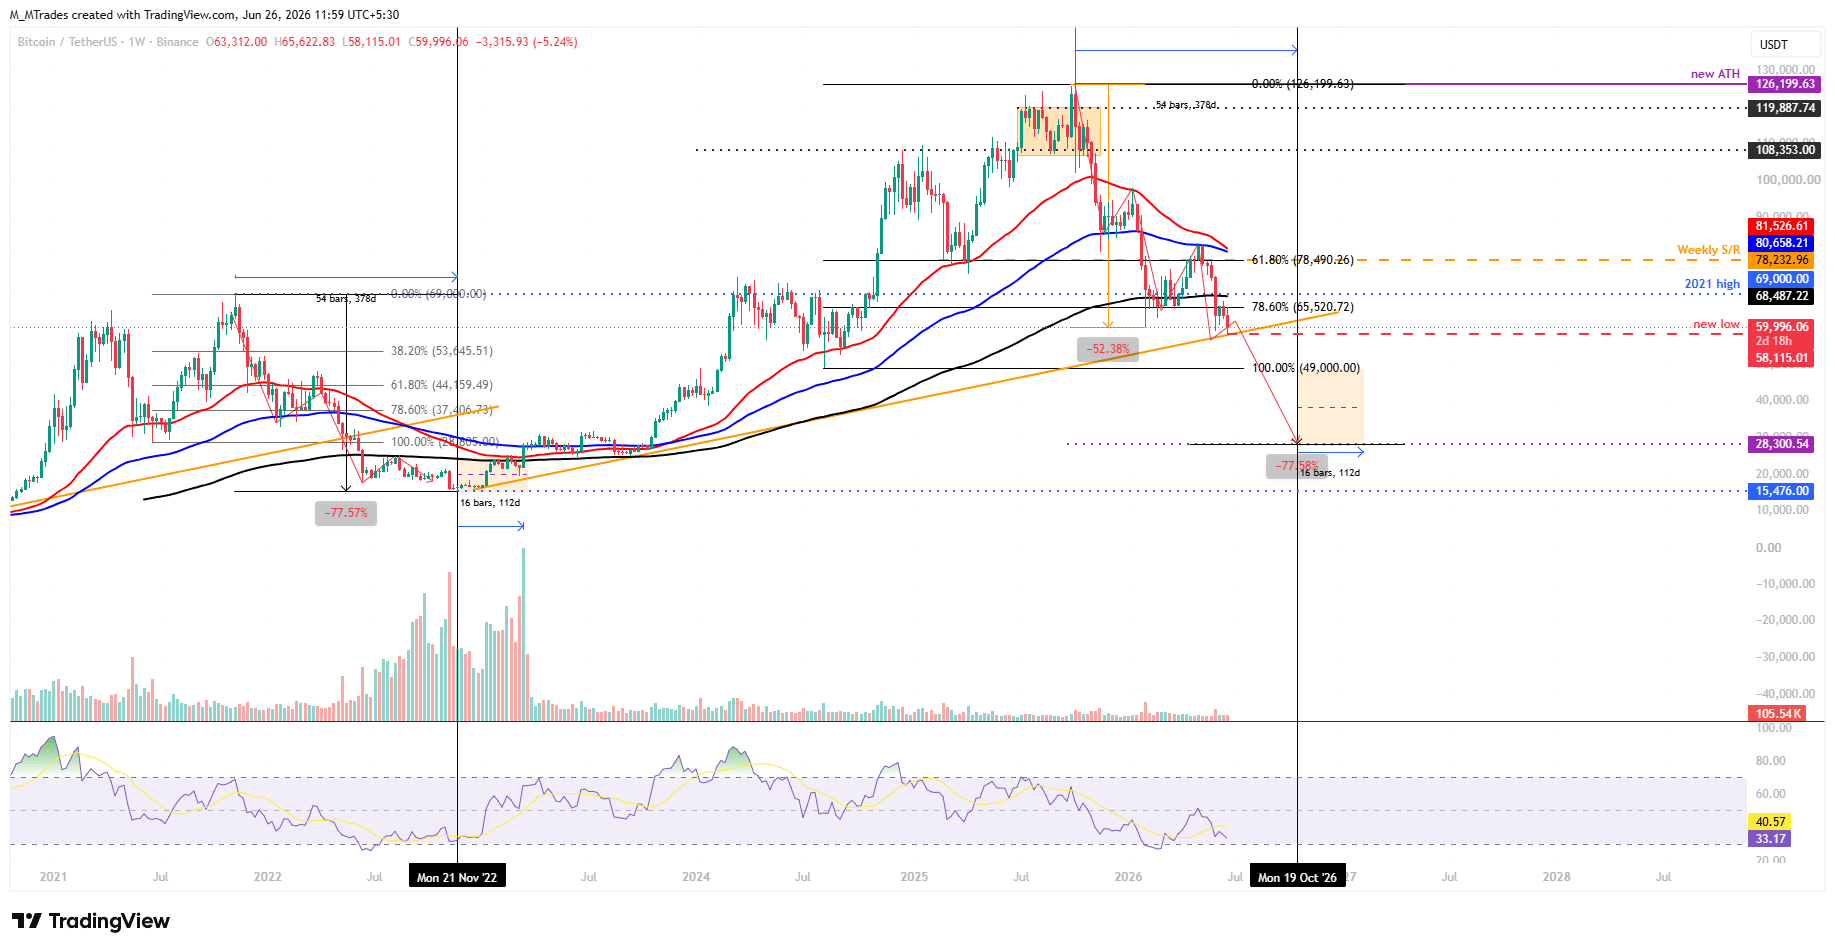
Bitcoin’s weekly chart shows price action resembling that of the late-2021-2022 bear market. In 2021, BTC hit a new all-time high (ATH) of $69,000 in November and then corrected 77.57% from the high to the 2022 bottom of around $15,476 over 378 days. Then consolidated for the next 112 days, before the start of another bull cycle in 2023.
In the 2025-2026 period, BTC reached a new ATH at $126,199 in October 2025 and has since corrected by 52.38%, reaching a low of $60,000 in the first week of February. Then, BTC recovered within the broader downtrend, retested, and faced rejection at the 100-Week EMA around $82,000 in early May. This rally between February and early May is considered by many analysts a bull trap before the primary downtrend resumes. Since the retest of this 100-Week EMA, BTC has corrected by over 29% and reached a new yearly low of $58,1153 this week.
If the current regime follows the 2021-2022 pattern, BTC could see further correction, reaching a low of $28,300 (77.51% from the 2025 ATH) by mid-October. Then it would consolidate for the next 112 days before the start of another bull cycle (as seen in 2023, discussed above).
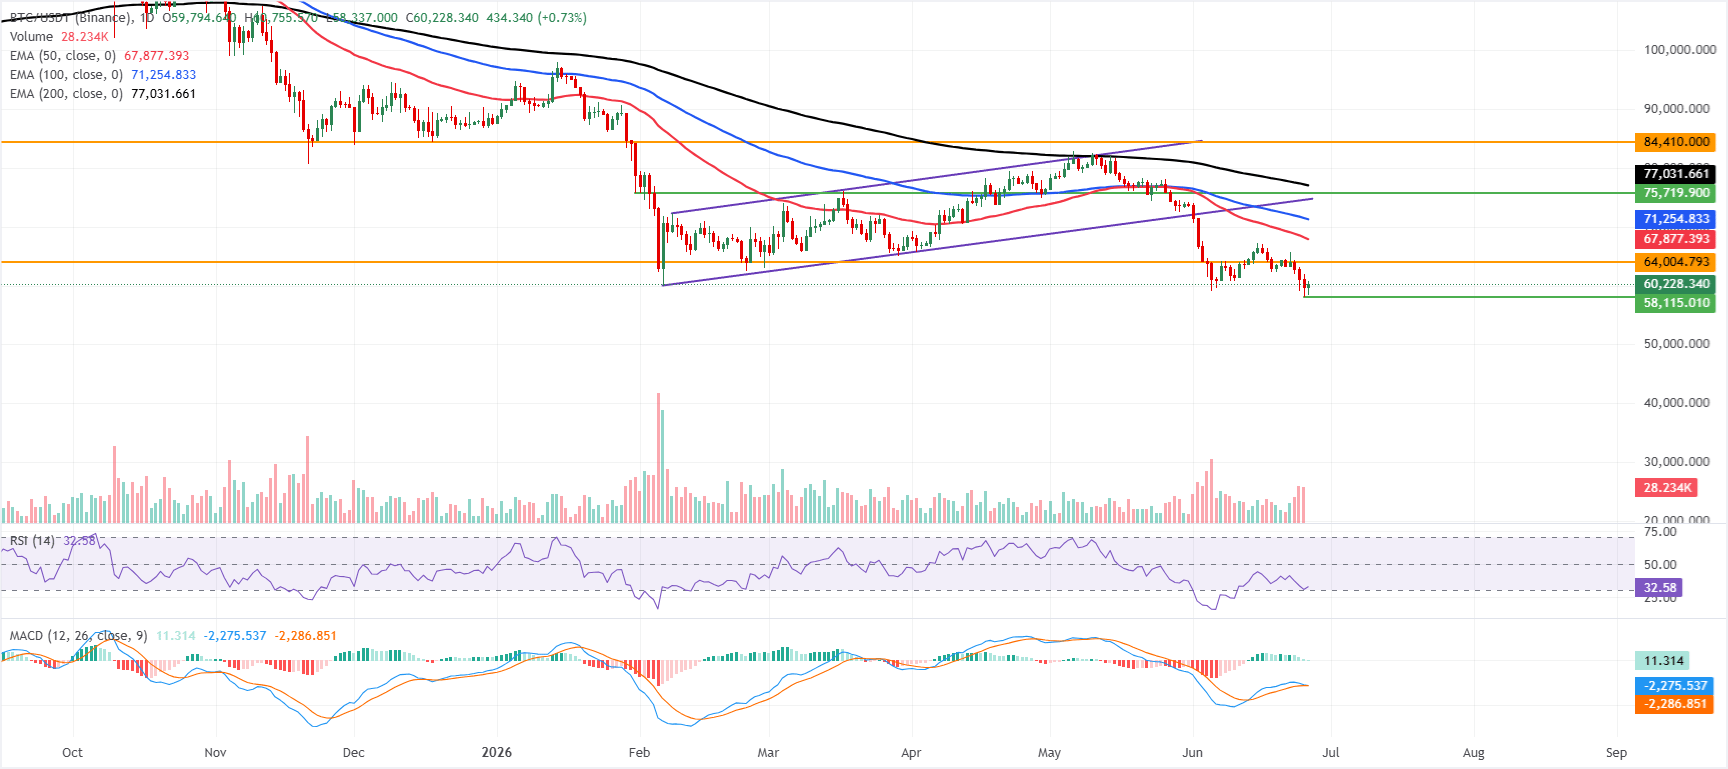
On the daily chart, BTC maintains a bearish bias, as price remains below the key EMAs. The 50-day, 100‑day and 200‑day EMAs are at $67,877, $71,255 and $77,031, respectively.
The Relative Strength Index (RSI) on the daily chart at 32 hovers just above oversold territory, while the Moving Average Convergence Divergence (MACD) has flattened near the zero line with a modest positive, which only hints at waning downside pressure rather than a decisive recovery.
On the topside, immediate resistance aligns with the previously drawn horizontal barrier at $64,004, ahead of the 50‑day EMA at $67,877 and the 100‑day EMA at $71,255, creating a dense supply zone that could cap any bounce. Above these, the 200‑day EMA at $77,031 and the distant horizontal level near $84,410 stand as broader trend obstacles, and the bearish outlook would likely persist while price holds below this stacked resistance structure.
(The technical analysis of this story was written with the help of an AI tool.)
Bitcoin, altcoins, stablecoins FAQs
Bitcoin is the largest cryptocurrency by market capitalization, a virtual currency designed to serve as money. This form of payment cannot be controlled by any one person, group, or entity, which eliminates the need for third-party participation during financial transactions.
Altcoins are any cryptocurrency apart from Bitcoin, but some also regard Ethereum as a non-altcoin because it is from these two cryptocurrencies that forking happens. If this is true, then Litecoin is the first altcoin, forked from the Bitcoin protocol and, therefore, an “improved” version of it.
Stablecoins are cryptocurrencies designed to have a stable price, with their value backed by a reserve of the asset it represents. To achieve this, the value of any one stablecoin is pegged to a commodity or financial instrument, such as the US Dollar (USD), with its supply regulated by an algorithm or demand. The main goal of stablecoins is to provide an on/off-ramp for investors willing to trade and invest in cryptocurrencies. Stablecoins also allow investors to store value since cryptocurrencies, in general, are subject to volatility.
Bitcoin dominance is the ratio of Bitcoin's market capitalization to the total market capitalization of all cryptocurrencies combined. It provides a clear picture of Bitcoin’s interest among investors. A high BTC dominance typically happens before and during a bull run, in which investors resort to investing in relatively stable and high market capitalization cryptocurrency like Bitcoin. A drop in BTC dominance usually means that investors are moving their capital and/or profits to altcoins in a quest for higher returns, which usually triggers an explosion of altcoin rallies.

超過一百萬用戶依賴 FXStreet 獲取即時市場數據、圖表工具、專家洞見與外匯新聞。其全面的經濟日曆與教育網路研討會協助交易者保持資訊領先、做出審慎決策。FXStreet 擁有約 60 人的團隊,分布於巴塞隆納總部及全球各地。
閱讀更多


