
Cardano Price Forecast: ADA extends losses as bearish signals emerge
作者 Manish Chhetri
更新: 30 Apr 2026


熱門文章

Cardano (ADA) price is trading at $0.244 on Thursday after falling over 3% so far this week. ADA’s on-chain and derivatives data hint at a mild bearish tilt with declining social dominance and increasing short bets.
- Cardano price extends losses after failing to reclaim the key technical barrier earlier this week.
- On-chain and derivatives data support a mildly bearish picture, with declining social dominance and rising short positions among traders.
- The technical outlook shows early bearish signals in momentum indicators, suggesting a deeper correction.
Cardano (ADA) price is trading at $0.244 on Thursday after falling over 3% so far this week. ADA’s on-chain and derivatives data hint at a mild bearish tilt with declining social dominance and increasing short bets. On the technical side, momentum indicators signal early bearish signs, suggesting deeper losses for ADA.
On-chain and derivatives metrics support a bearish picture
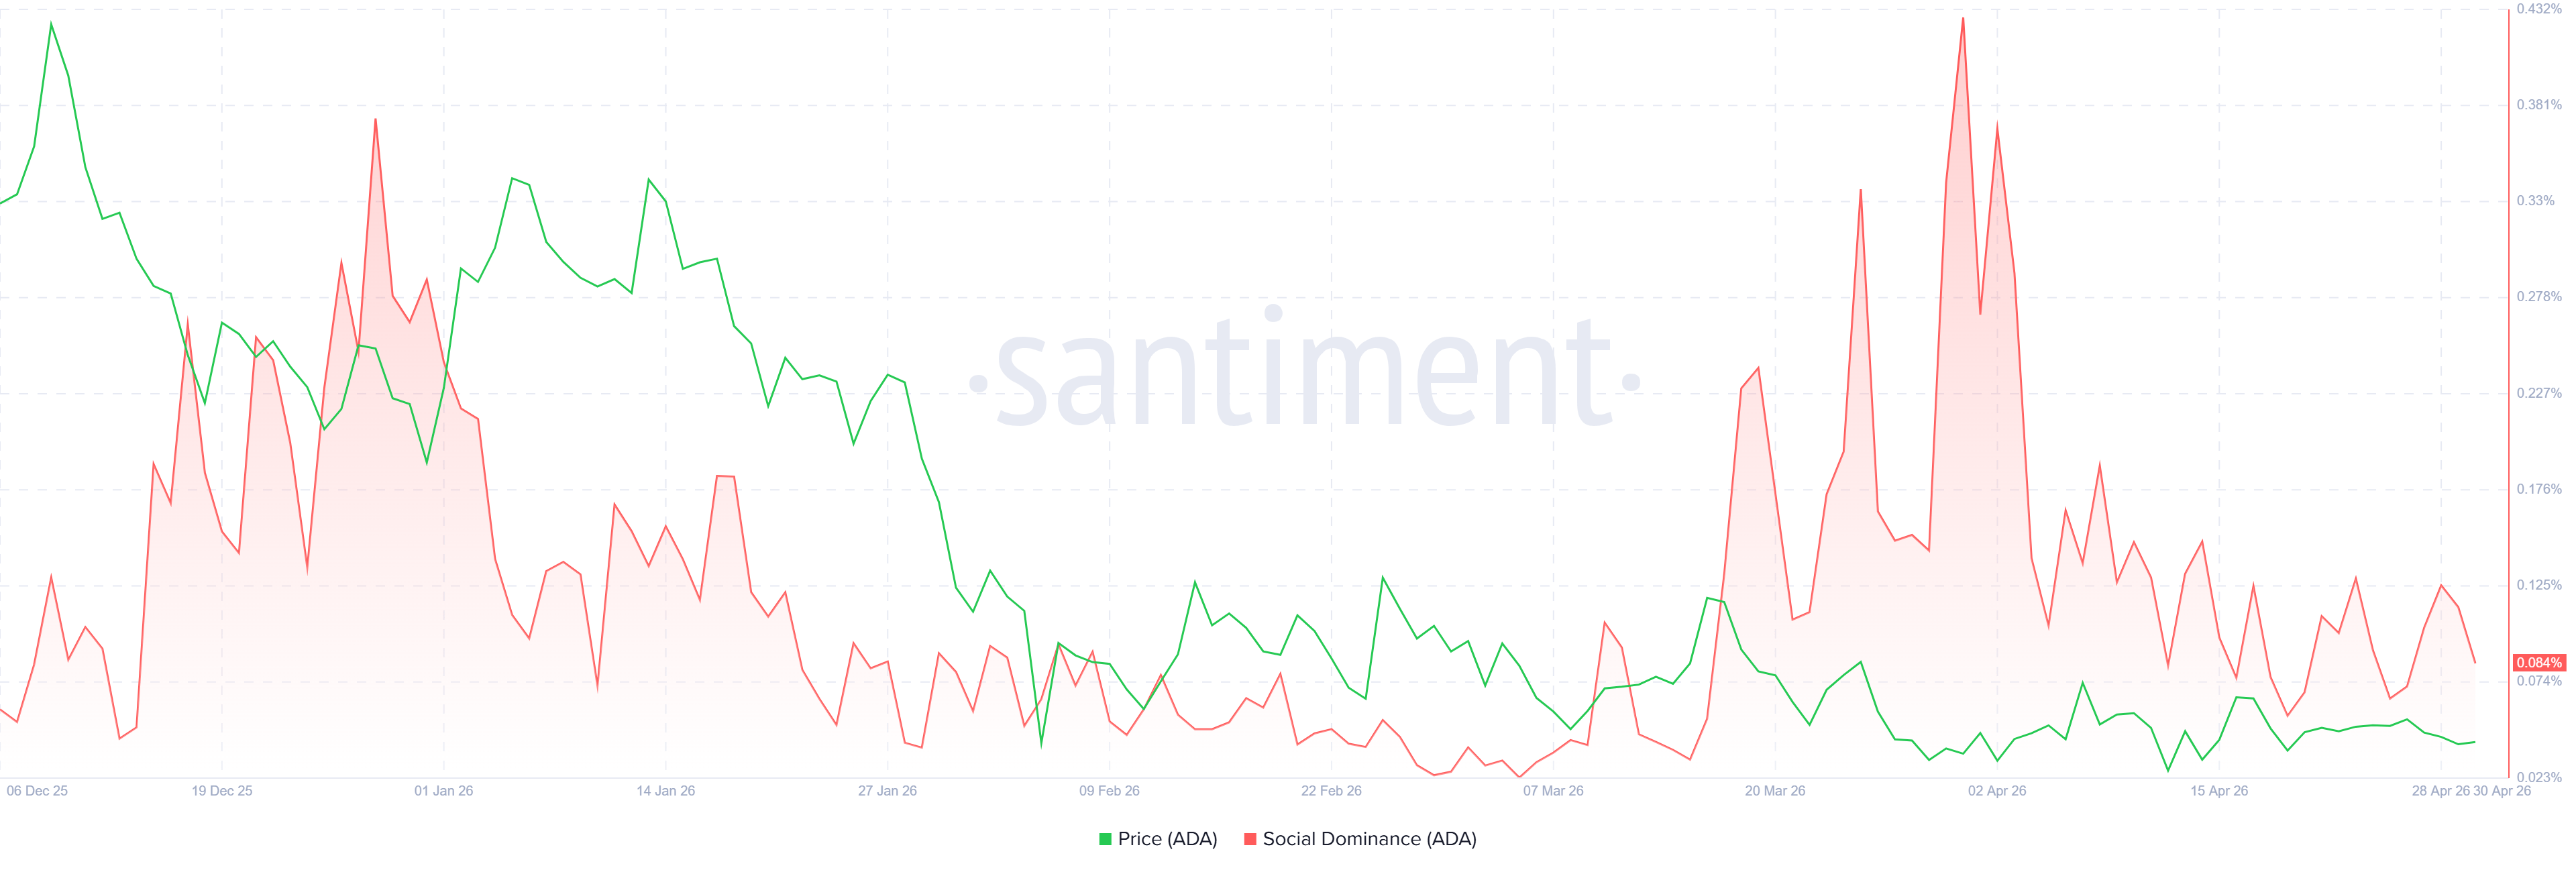
Santiment’s Social Dominance metric for Cardano supports a bearish outlook. The index measures the share of ADA-related discussions across the cryptocurrency media. It fell sharply, reading 0.084% on Thursday and has remained in a downward trend since early April. This fall indicates fading market interest and weakening sentiment among ADA investors.
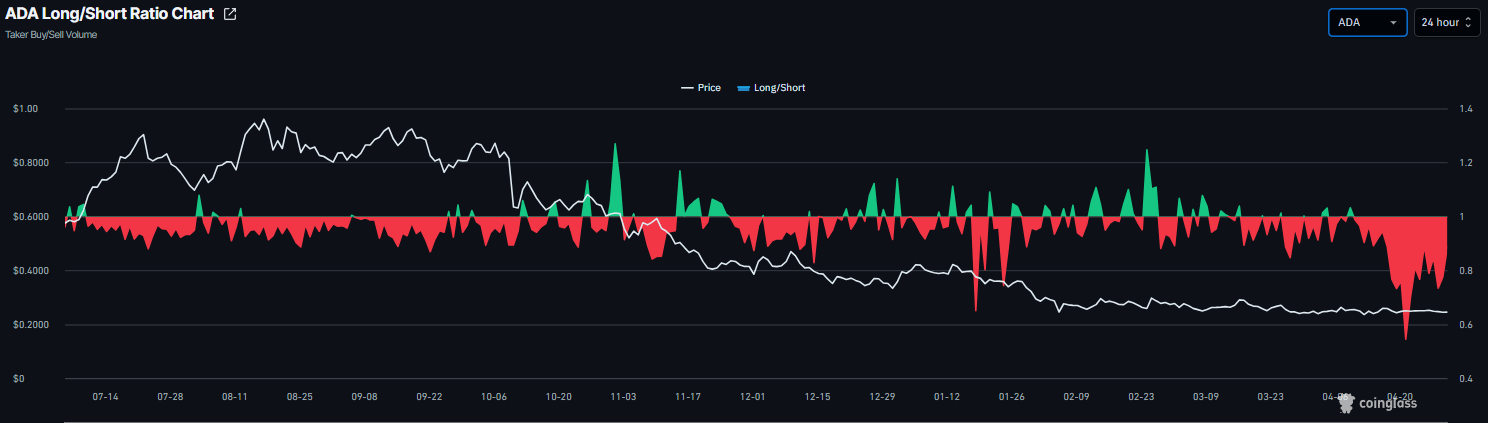
On the derivatives side, Cardano traders’ short bets continue to remain strong. CoinGlass’ long-to-short ratio for ADA reads 0.88 on Thursday and has mostly remained in the red territory since early April. This ratio, being below one, reflects bearish sentiment in the market, as more traders are betting on the asset’s price to fall.
Cardano Price Forecast: Fails to reclaim key technical barrier
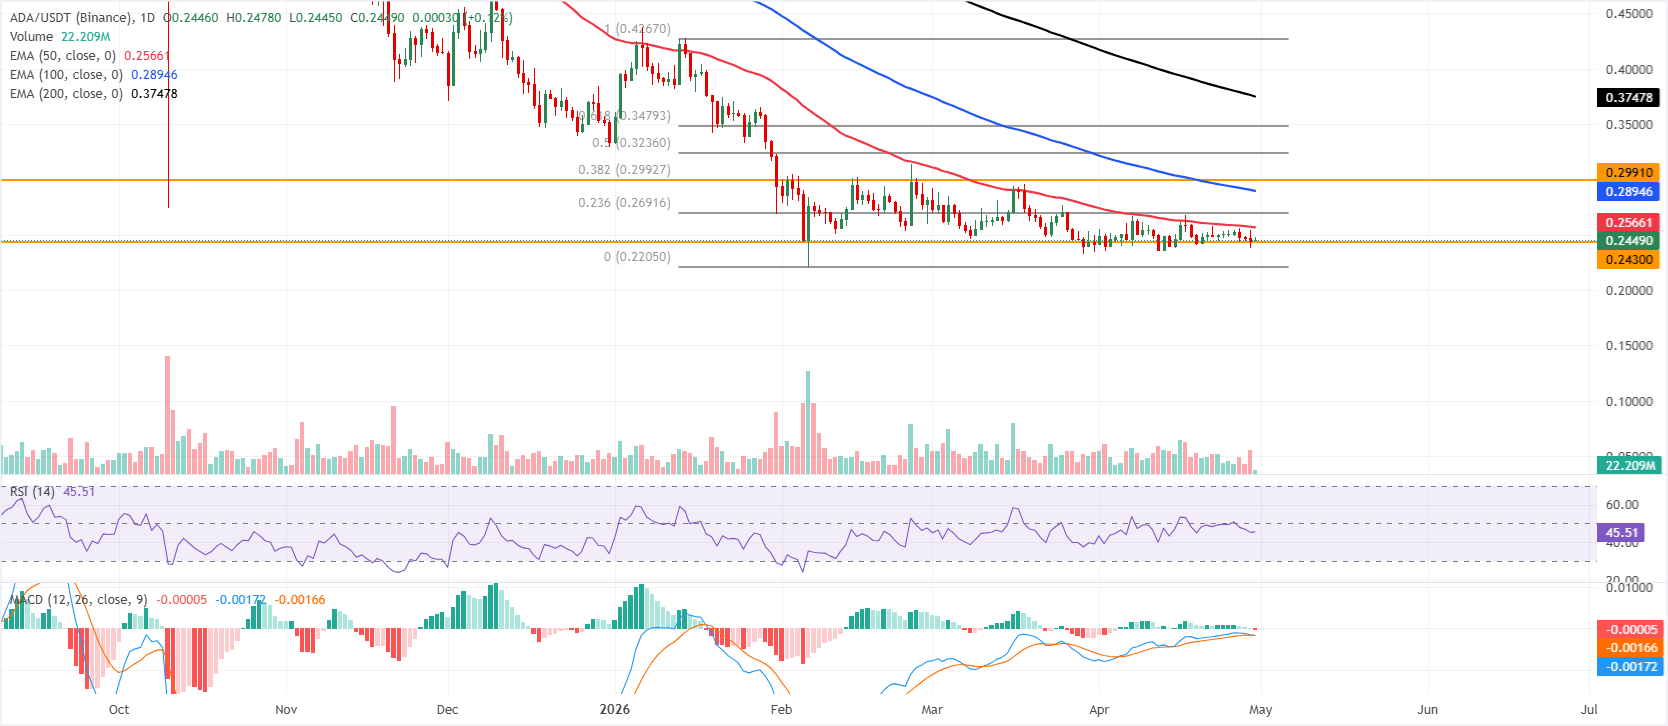
Cardano price is trading at $0.244 on Thursday after failing to close above the key 50-day Exponential Moving Average (EMA) at $0.256 earlier this week. Moreover, ADA is maintaining a broadly bearish tone as price holds well below the 50-day, 100-day, and 200-day EMAs, which are clustered between $0.256 and $0.374.
ADA is hovering just above horizontal support at $0.243, while the Relative Strength Index (RSI) is near 46 and a flat Moving Average Convergence Divergence (MACD) around the zero line hints at subdued momentum rather than an imminent trend reversal.
On the downside, immediate demand is seen at the horizontal floor around $0.243, with the Fibonacci anchor near $0.220 providing a deeper support area if selling pressure resumes.
On the topside, initial resistance comes at the 50-day EMA near $0.256, followed by the 23.6% Fibonacci retracement at $0.269 and the 100-day EMA around $0.289; beyond that, a broader supply band emerges between the horizontal barrier at $0.299.
(The technical analysis of this story was written with the help of an AI tool.)

超過一百萬用戶依賴 FXStreet 獲取即時市場數據、圖表工具、專家洞見與外匯新聞。其全面的經濟日曆與教育網路研討會協助交易者保持資訊領先、做出審慎決策。FXStreet 擁有約 60 人的團隊,分布於巴塞隆納總部及全球各地。
閱讀更多


