
Cardano Price Forecast: ADA suffers from $900 million loss realization as prices bounce near $0.34
作者 Michael Ebiekutan
發布日期: 20 Dec 2025 | 修改日期: 20 Dec 2025


熱門文章

Loss realization among Cardano (ADA) holders increased sharply in December, marking one of its heaviest capitulation months since 2023. Since the beginning of the month, investors have realized over $900 million in losses as of Friday.
ADA price today: $0.37
- ADA investors have booked over $900 million in losses in December.
- Investors who bought ADA in the past 365 days are holding average losses of nearly 40%.
- ADA is testing the resistance near $0.37 after bouncing off $0.34.
Loss realization among Cardano (ADA) holders increased sharply in December, marking one of its heaviest capitulation months since 2023. Since the beginning of the month, investors have realized over $900 million in losses as of Friday.
 [04-1766200998267-1766200998268.21.38, 20 Dec, 2025].png)
The move comes as bearish sentiment following the October 10 crash saw ADA erase all its gains from over the past 14 months.
With prices plunging toward $0.35, all ADA investors are holding an average loss of 40%. Notably, investors who bought the token in the past 365 days are also experiencing losses of a similar size.
As a result, most investors began cutting losses in December.
 [04-1766201047603-1766201047604.22.03, 20 Dec, 2025].png)
Large holders fueled selling activity amid open interest contraction
On the spot market, the intense selling pressure majorly flowed from wallets holding 1M-10M ADA, as their collective holdings dropped by 130M ADA since the beginning of the month.
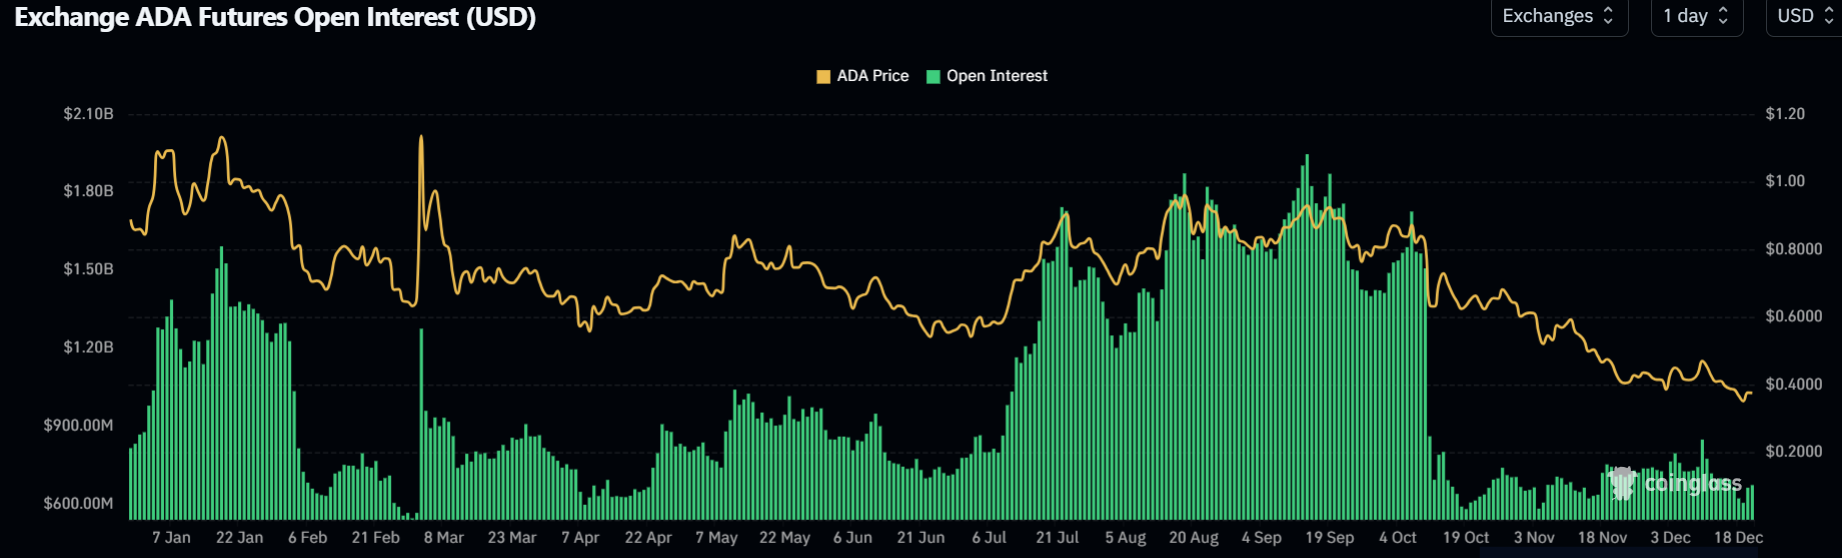
On the derivatives side, ADA's futures open interest remains subdued at around $657 million as of Friday, with market participants staying on the sidelines since the October 10 crash.
ADA is trading at $0.37, up 4% at publication time on Saturday.
Cardano Price Forecast: ADA faces resistance at $0.37
ADA bounced off $0.34 and is testing the $0.37 resistance, near the upper boundary of the descending channel. The channel's resistance is strengthened by the 20-day Exponential Moving Average (EMA), which has proven a key hurdle since October 10.
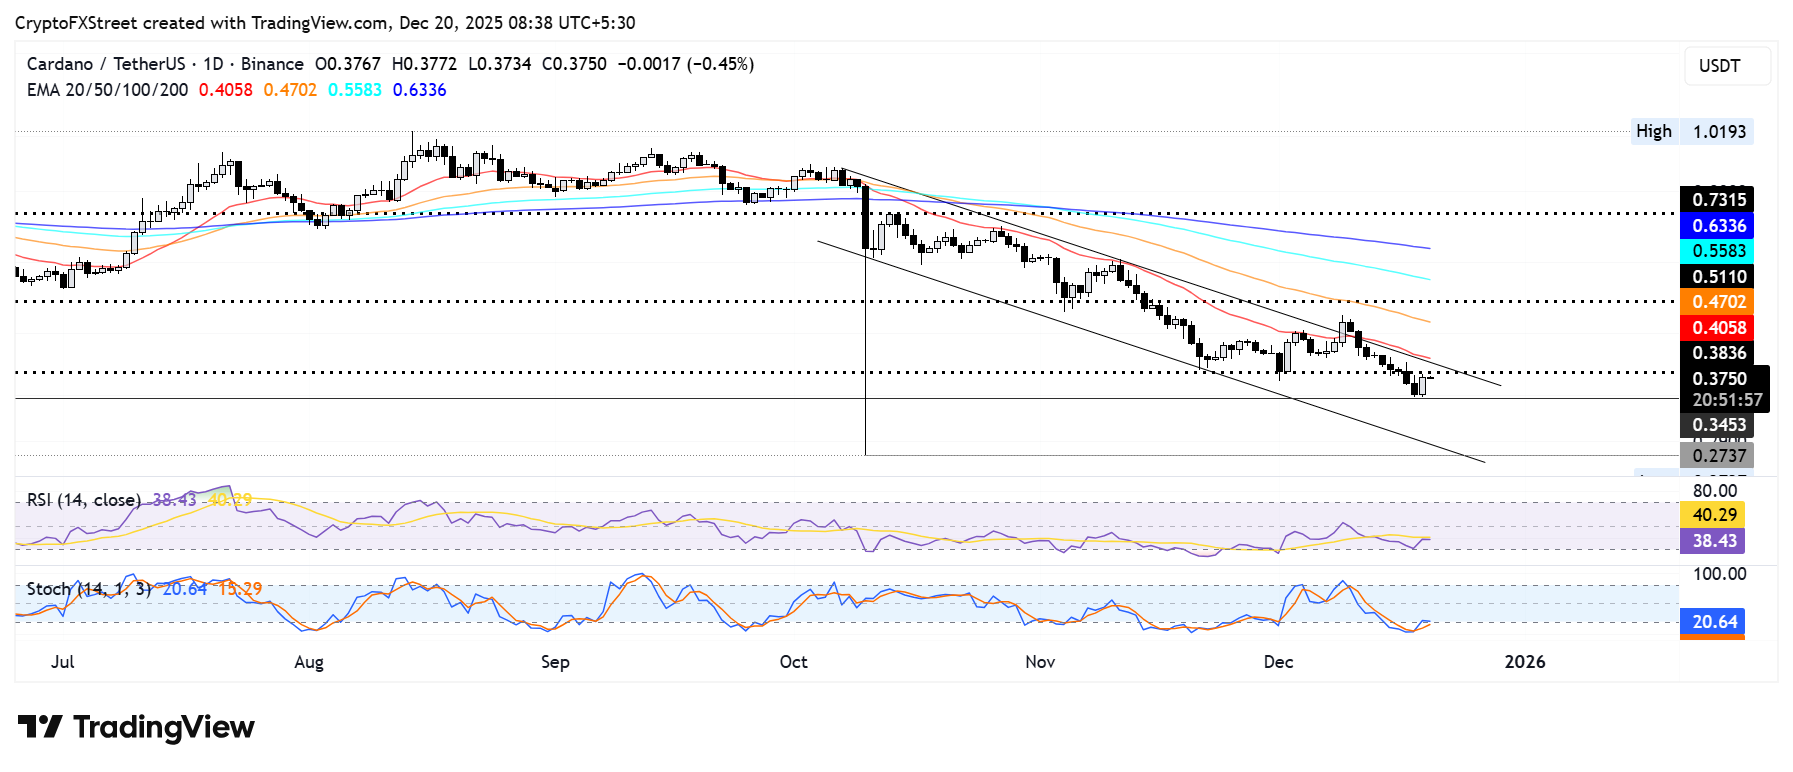
A rise above the descending channel could see ADA test the $0.51 level, but it has to clear the 50-day EMA on the way up. On the downside, ADA could find support at $0.34.
The Relative Strength Index (RSI) is below its neutral level and testing its moving average line. Meanwhile, the Stochastic Oscillator (Stoch) is attempting to recover from oversold conditions.

超過一百萬用戶依賴 FXStreet 獲取即時市場數據、圖表工具、專家洞見與外匯新聞。其全面的經濟日曆與教育網路研討會協助交易者保持資訊領先、做出審慎決策。FXStreet 擁有約 60 人的團隊,分布於巴塞隆納總部及全球各地。
閱讀更多


