
Cardano Price Forecast: Consolidation near support as bearish momentum eases
作者 Manish Chhetri
更新: 1 Jul 2026


熱門文章

Cardano (ADA) trades around $0.146 on Wednesday, stabilizing after a sharp correction as selling pressure eases. Weakening derivatives metrics indicate traders remain cautious, while fading bearish momentum indicators suggest a potential recovery for ADA.
- Cardano price consolidates around $0.146 on Wednesday after a recent sell-off.
- Weakening derivatives activity, with declining open interest and rising short positions, continues to support a cautious near-term outlook.
- The technical outlook shows bearish momentum is fading, raising the possibility of a potential recovery.
Cardano (ADA) trades around $0.146 on Wednesday, stabilizing after a sharp correction as selling pressure eases. Weakening derivatives metrics indicate traders remain cautious, while fading bearish momentum indicators suggest a potential recovery for ADA.
Derivatives traders remain cautious
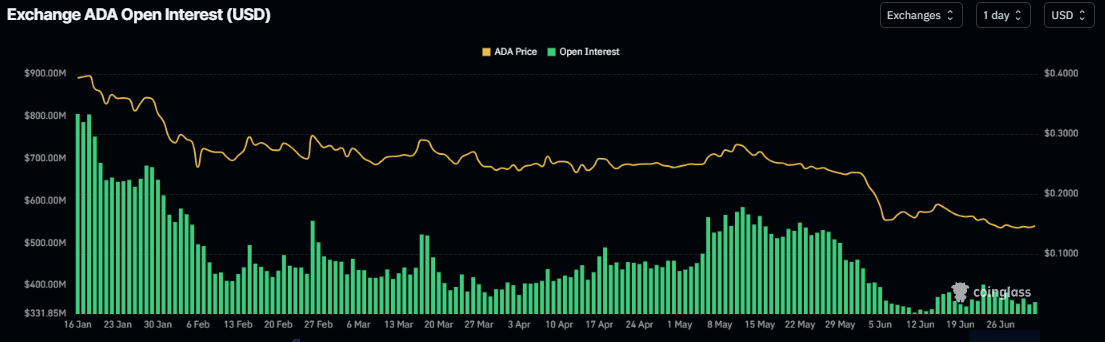
Cardano’s derivatives metrics support a negative outlook. ADA’s futures Open Interest (OI) dropped to $360 million on Wednesday after a mild rise in mid-May but has been continuously falling since mid-January. This drop in OI reflects waning investor participation and projects a bearish outlook.
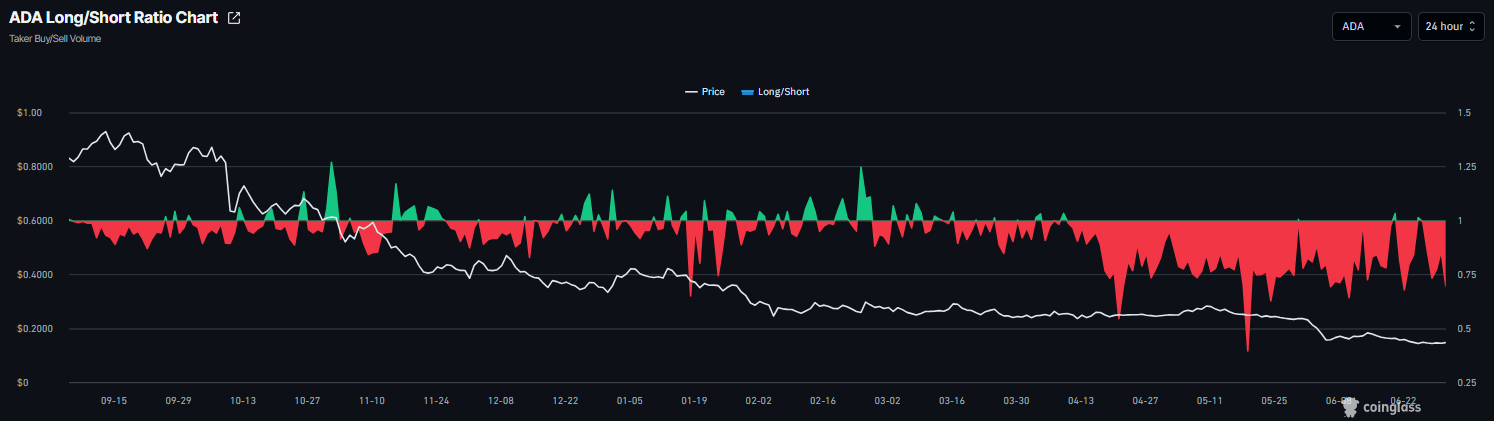
In addition, CoinGlass’ long-to-short ratio for ADA reads 0.69 on Wednesday, nearing its lowest level in over a month. This ratio, being below one, reflects bearish sentiment in the market, as more traders are betting on the asset’s price to fall.
Some signs of optimism
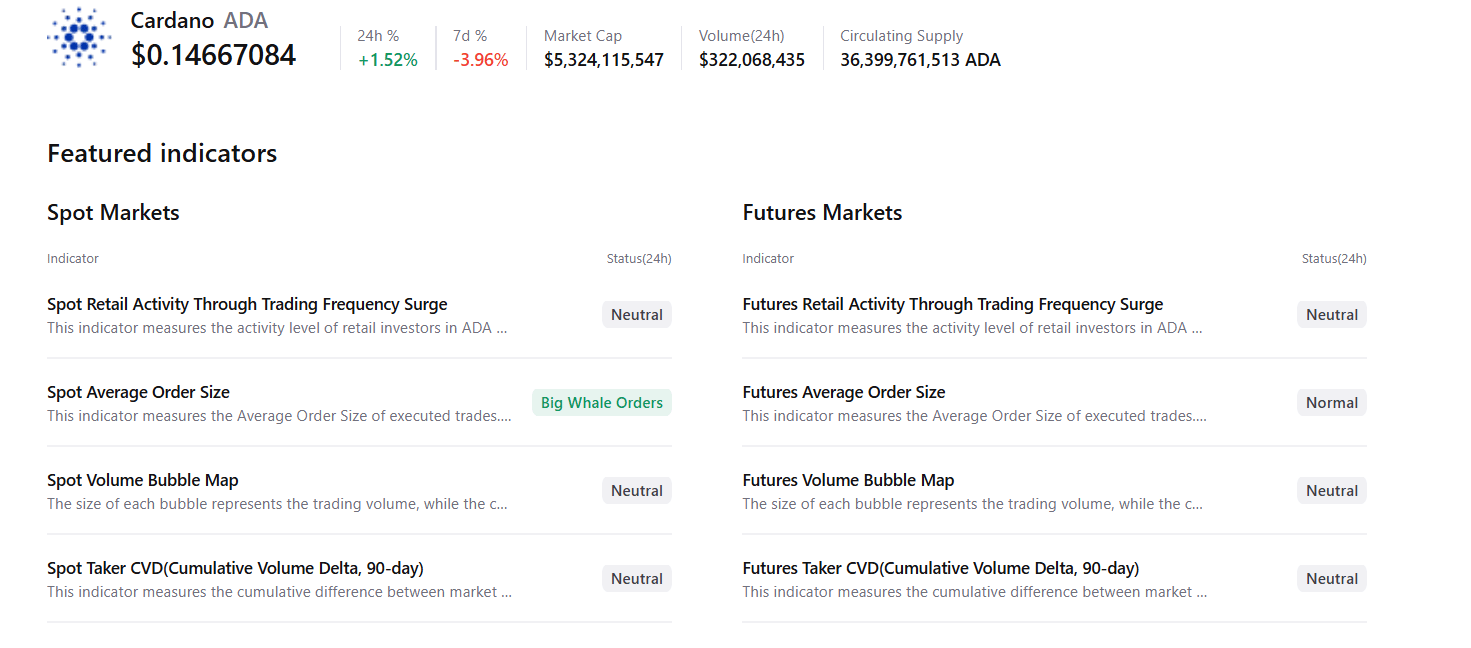
CryptoQuant’s summary data shows mild bullish sentiment. Cardano’s spot markets show large whale orders amid neutral conditions across other metrics, supporting a potential recovery.
Cardano Price Forecast: Fading bearish momentum
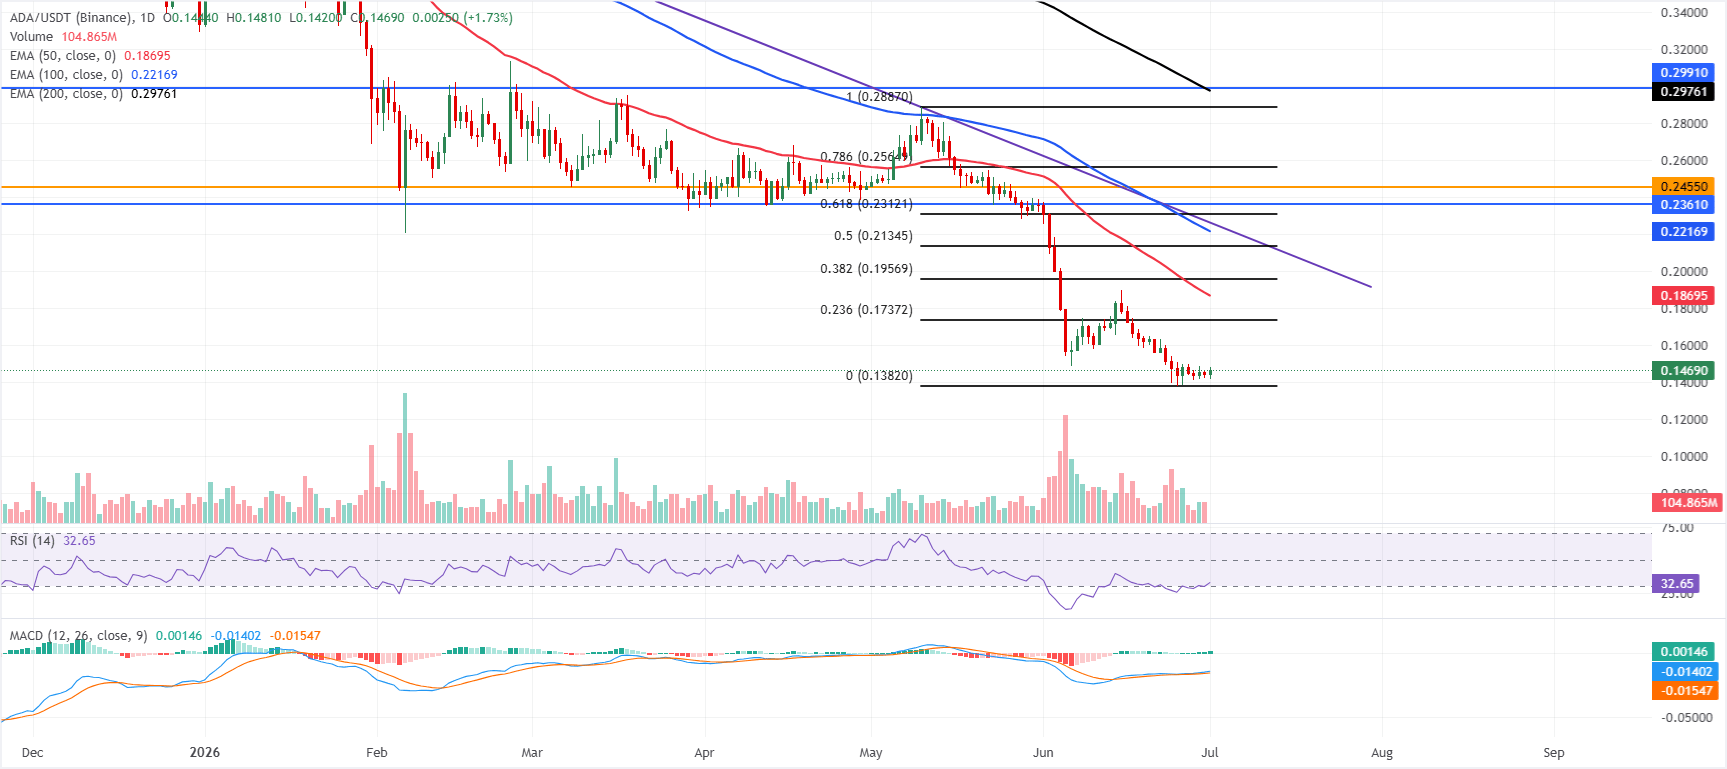
Cardano price trades at $0.146 on Wednesday, consolidating after a recent correction. However, ADA maintains a long-term bearish bias, with price holding well below the 50-day, 100-day, and 200-day Exponential Moving Averages (EMAs) at roughly $0.187, $0.221, and $0.297.
The Relative Strength Index (RSI) has stabilized near 33, and the Moving Average Convergence Divergence (MACD) line remains slightly positive, hinting at tentative downside fatigue but not yet altering the overarching downward structure.
On the topside, initial resistance is seen at the 23.6% Fibonacci retracement near $0.173, ahead of the 50-day EMA around $0.187 and the 38.2% Fibonacci retracement close to $0.1957. Further up, the 50% retracement level at $0.213, the 100-day EMA at $0.221 and the downtrend resistance trendline’s break area near $0.226 form a broader supply band, followed by clustered barriers between the 61.8% Fibonacci retracement at $0.231, horizontal caps at $0.236 and $0.245, and the upper band defined by $0.256–$0.299 including the 78.6% Fibonacci retracement, the 200-day EMA around $0.2976 and overhead horizontal resistance.
On the downside, immediate support sits at the Fibonacci anchor at $0.1382; a clear break below this floor would expose fresh lows in the broader downtrend.
(The technical analysis of this story was written with the help of an AI tool.)

超過一百萬用戶依賴 FXStreet 獲取即時市場數據、圖表工具、專家洞見與外匯新聞。其全面的經濟日曆與教育網路研討會協助交易者保持資訊領先、做出審慎決策。FXStreet 擁有約 60 人的團隊,分布於巴塞隆納總部及全球各地。
閱讀更多


