
Cardano Price Forecast: Momentum improves as ADA nears key resistance
作者 Manish Chhetri
更新: 27 Apr 2026


熱門文章
Cardano (ADA) extends its recovery, approaching its key resistance at $0.258 on Monday, where a decisive breakout could open the door to further gains.
- Cardano price extends recovery on Monday, nearing key resistance at $0.258, where a firm close above suggests gains ahead.
- Derivatives data remains mixed, limiting the upside move and keeping traders cautious near resistance.
- The technical indicators show improving momentum, suggesting bullish pressure is building and a potential breakout could be on the horizon.
Cardano (ADA) extends its recovery, approaching its key resistance at $0.258 on Monday, where a decisive breakout could open the door to further gains. While derivatives data reflects mixed trader sentiment, the recent shift in funding rates and neutral positioning across spot and futures markets suggest cautious optimism is beginning to build.
Mixed sentiment on the derivatives market
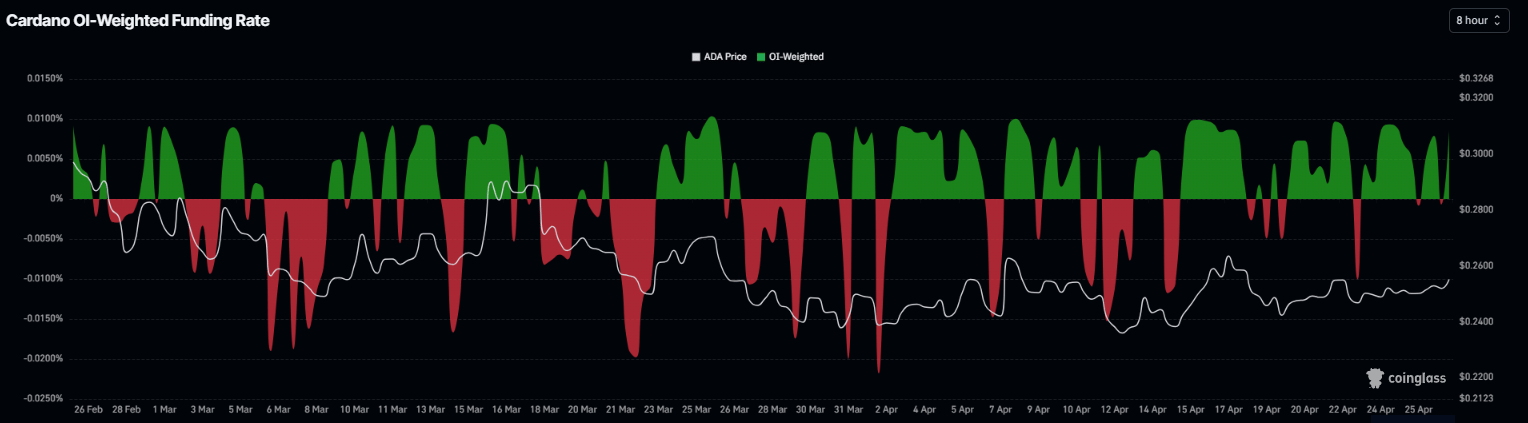
Cardano’s derivatives data shows mixed signals, limiting the upside move. CoinGlass’ OI-Weighted Funding Rate data for Cardano flipped positive on Monday, reading 0.0085%, indicating that long-position traders are paying shorts and suggesting a mildly bullish market bias. However, funding rates have been swinging between positive and negative since last week, highlighting unstable trader conviction and suggesting that bullish momentum still lacks strong confirmation.
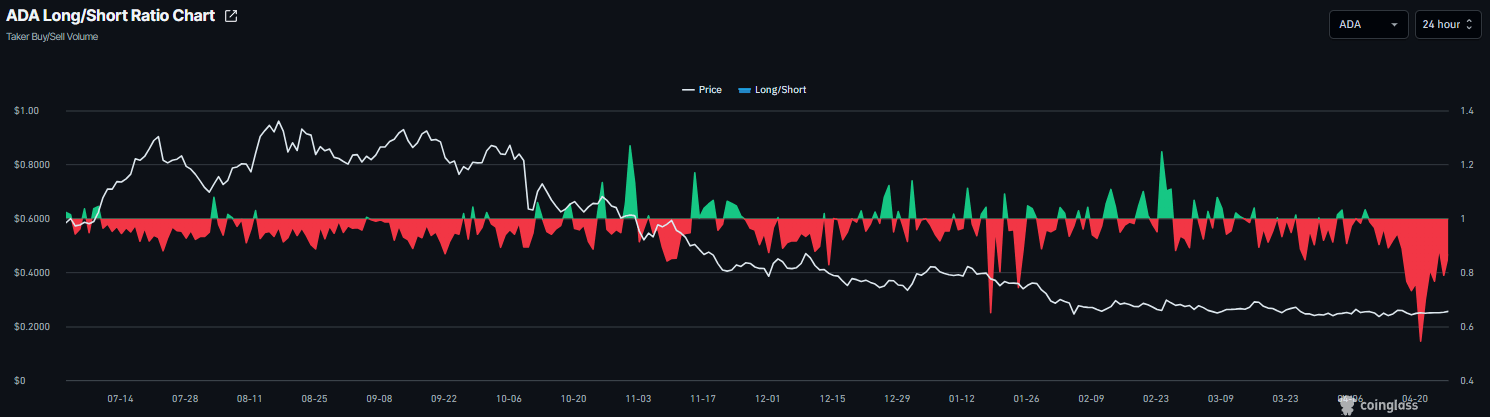
In addition, CoinGlass’ long-to-short ratio for ADA reads 0.86 on Monday, nearing its lowest level in over a month. This ratio, being below one, reflects bearish sentiment in the market, as more traders are betting on the asset’s price to fall.
This combination suggests indecision among Cardano investors, which limits the chances of a sustained recovery.
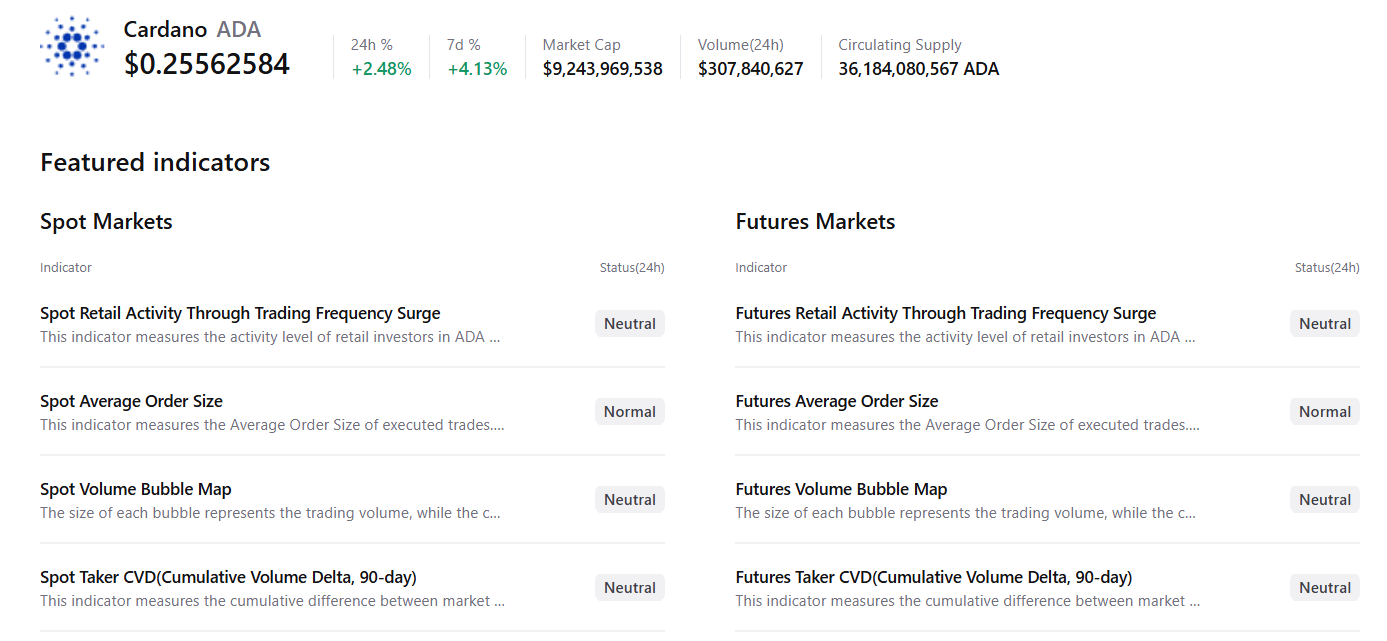
CryptoQuant’s summary data for Cardano also shows neutral conditions among the spot and futures traders, as shown below, suggesting that market participants remain cautious despite the recent price recovery.
Cardano Price Forecast: Momentum indicators show signs of improvement
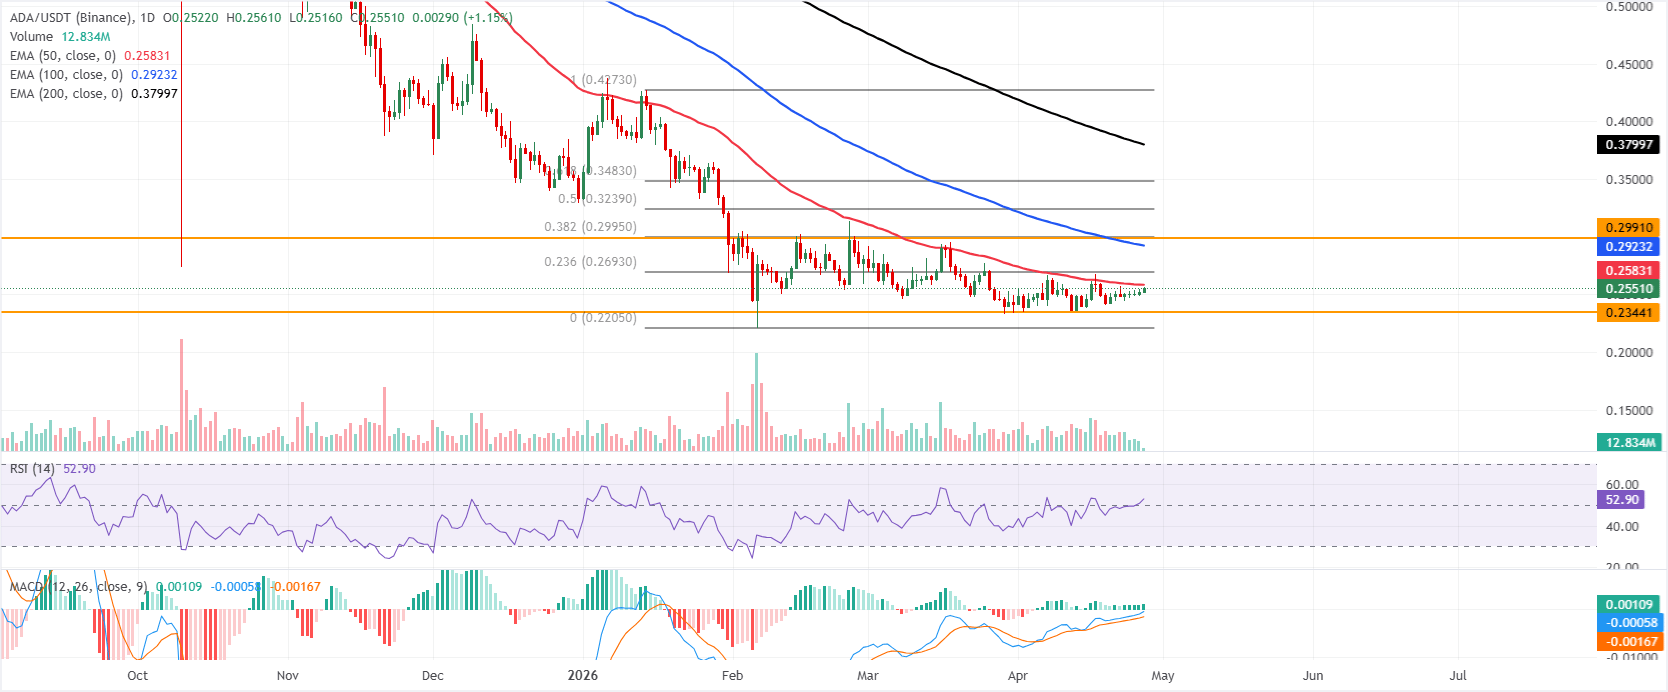
Cardano is trading above $0.255 on Monday after a mild recovery last week. ADA is keeping a capped tone as price holds beneath the 50-day Exponential Moving Average (EMA) at $0.258 and well below the 100-day and 200-day EMAs at $0.292 and $0.379, respectively.
Momentum has improved, with the Relative Strength Index (RSI) on the daily chart hovering above 50 and the Moving Average Convergence Divergence (MACD) line in marginal positive territory, hinting at stabilizing downside pressure but not yet negating the broader bearish structure defined by the dominant overhead averages and Fibonacci retracements.
On the topside, initial resistance emerges at the 50-day EMA around $0.258, followed by the 23.6% Fibonacci retracement at $0.269, while stronger supply is seen near the 100-day EMA at $0.292 and the $0.299 band, where a horizontal resistance converges with the 38.2% retracement.
On the downside, immediate support lies at the horizontal level of $0.243, ahead of a more substantial structural floor at the Fibonacci anchor near $0.220, where buyers are expected to defend the latest cycle low.
(The technical analysis of this story was written with the help of an AI tool.)

超過一百萬用戶依賴 FXStreet 獲取即時市場數據、圖表工具、專家洞見與外匯新聞。其全面的經濟日曆與教育網路研討會協助交易者保持資訊領先、做出審慎決策。FXStreet 擁有約 60 人的團隊,分布於巴塞隆納總部及全球各地。
閱讀更多


