
Crypto Market Overview: Bitcoin slips below $80,000 as US military strikes Iran
作者 Vishal Dixit
更新: 8 May 2026


熱門文章

Bitcoin (BTC) is trading below $80,000 at press time on Friday, retracing after a bearish close the previous day. The renewed military action between the US and Iran risks breaking the ceasefire, weighing on investor interest.
- Bitcoin slips below $80,000 on Friday, risking a bearish end to this week.
- US forces targeted Iranian military facilities in retaliation for its three Navy destroyers being attacked in the Strait of Hormuz.
- Ondo, World Liberty Financial, and Virtuals Protocol emerge as top performers over the last 24 hours.
Bitcoin (BTC) is trading below $80,000 at press time on Friday, retracing after a bearish close the previous day. The renewed military action between the US and Iran risks breaking the ceasefire, weighing on investor interest. Meanwhile, Ondo (ONDO), World Liberty Financial (WLFI), and Virtuals Protocol (VIRTUAL) emerge as top performers over the last 24 hours.
Bitcoin loses ground amid renewed US-Iran tensions
The US Central Command said on Thursday that the US forces targeted Iranian military facilities responsible for launching attacks on its three Navy destroyers transiting the Strait of Hormuz, as previously reported by FXStreet. The renewed stress in Middle East affairs has spiked Oil prices and weighed on broader market risk appetite.
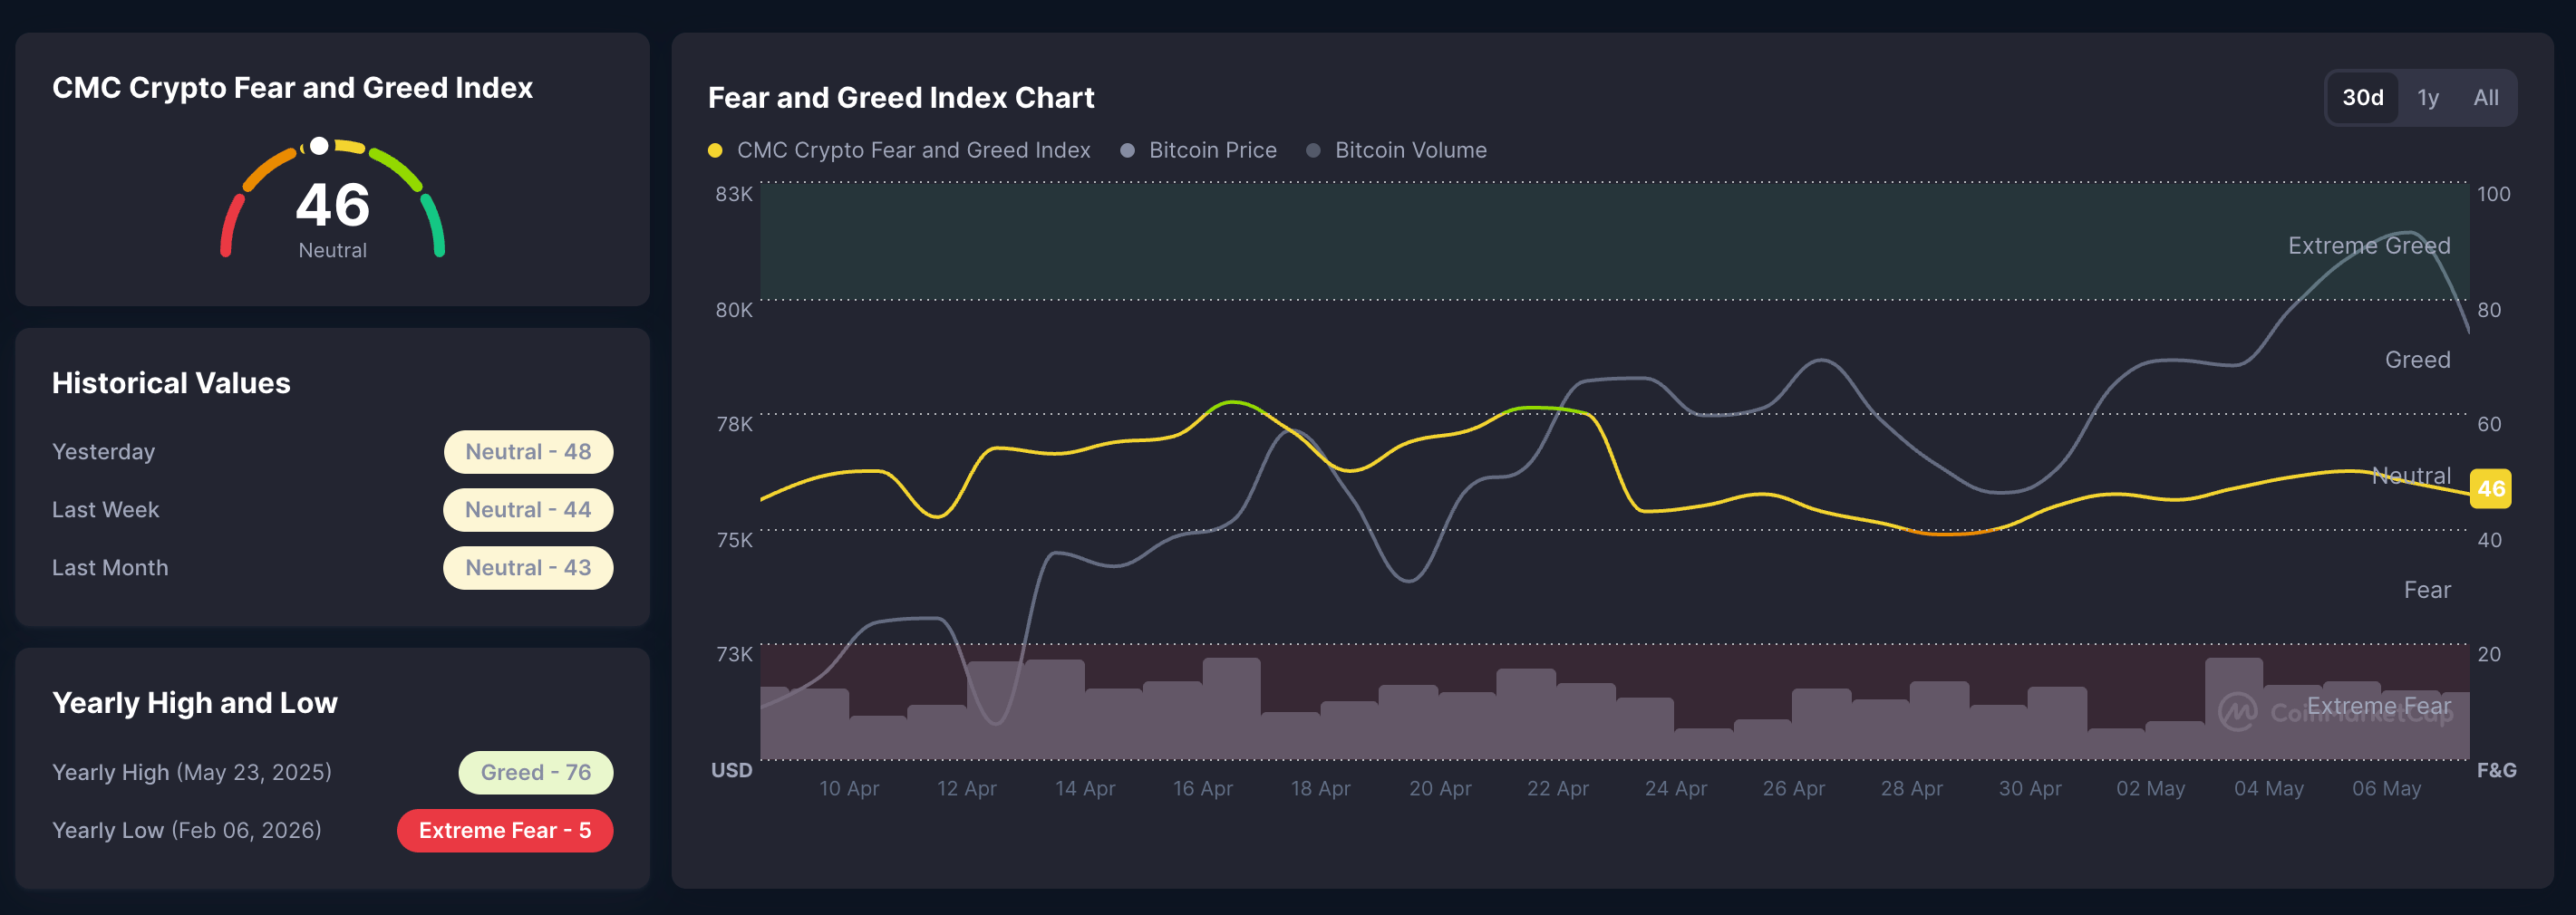
In the crypto market, the Fear and Greed Index by CoinMarketCap fell to 46 on Friday, suggesting a return to risk-off sentiment.
Bitcoin slips below $80,000 on Friday, extending the losses from the previous day. Still, BTC keeps a constructive bullish bias as price holds well above the 50-day and 100-day Exponential Moving Averages (EMAs) near $75,326 and $76,271, respectively. This positioning suggests the broader uptrend remains intact despite the recent pullback from record highs, while the 200-day EMA at roughly $81,871 looms as the next major topside barrier.
Momentum remains positive but not overstretched, with the Relative Strength Index (RSI) hovering around 60 and the Moving Average Convergence Divergence (MACD) line still in positive territory, close to its signal line, hinting that buying pressure is moderating rather than reversing.
On the downside, initial support is seen around the 100-day EMA at about $76,271 and the 50-day EMA near $75,326. A break below this confluence would expose the longer-term rising trend-line support drawn from the $60,000 area, last referenced around $69,436.
Looking up, bulls could face key resistance at the 200-day EMA near $81,871, and a sustained break above this level would likely reopen the path toward $90,000.
Top Crypto Gainers: ONDO, WLFI, and VIRTUAL lead gains
ONDO trades above $0.3500 at press time on Friday, holding steady after a 9% jump the previous day. ONDO maintains a firm bullish bias, trading well above the 50-day EMA at roughly $0.2786 while still below the longer-term 200-day EMA near $0.4072, suggesting an advancing but not yet fully matured uptrend.
The MACD line extends an upward trend above its signal line, with expanding positive histogram bars, reinforcing growing upside momentum. At the same time, RSI hovers deep in overbought territory around 83, suggesting buyers may face exhaustion risk even as the broader tone remains constructive.
On the topside, the next resistance comes in first at the December 19 low at $0.360, followed by the 200-day EMA near $0.4072, where a clear breakout would strengthen the medium-term recovery narrative.
Initial support is seen at the 100- and 50-day EMAs around $0.3036 and $0.2786, respectively.
WLFI takes a breather above $0.0700 at the time of writing on Friday, after six consecutive days of recovery. Still, WLFI maintains a bearish near-term bias as price holds well beneath both the 50-day and 100-day EMAs at $0.0817 and $0.0982, respectively.
The downward placement of these medium- and longer-term EMAs suggests rallies remain corrective for now, although the MACD histograms have turned positive after a crossover on Wednesday and the RSI at 49 hovers near the neutral midline, hinting that selling pressure is losing intensity.
Initial resistance is at the 50-day EMA around $0.0817, where any recovery is likely to encounter the first major supply zone. A sustained break above this barrier would then expose the 100-day EMA near $0.0982 as the next key cap.
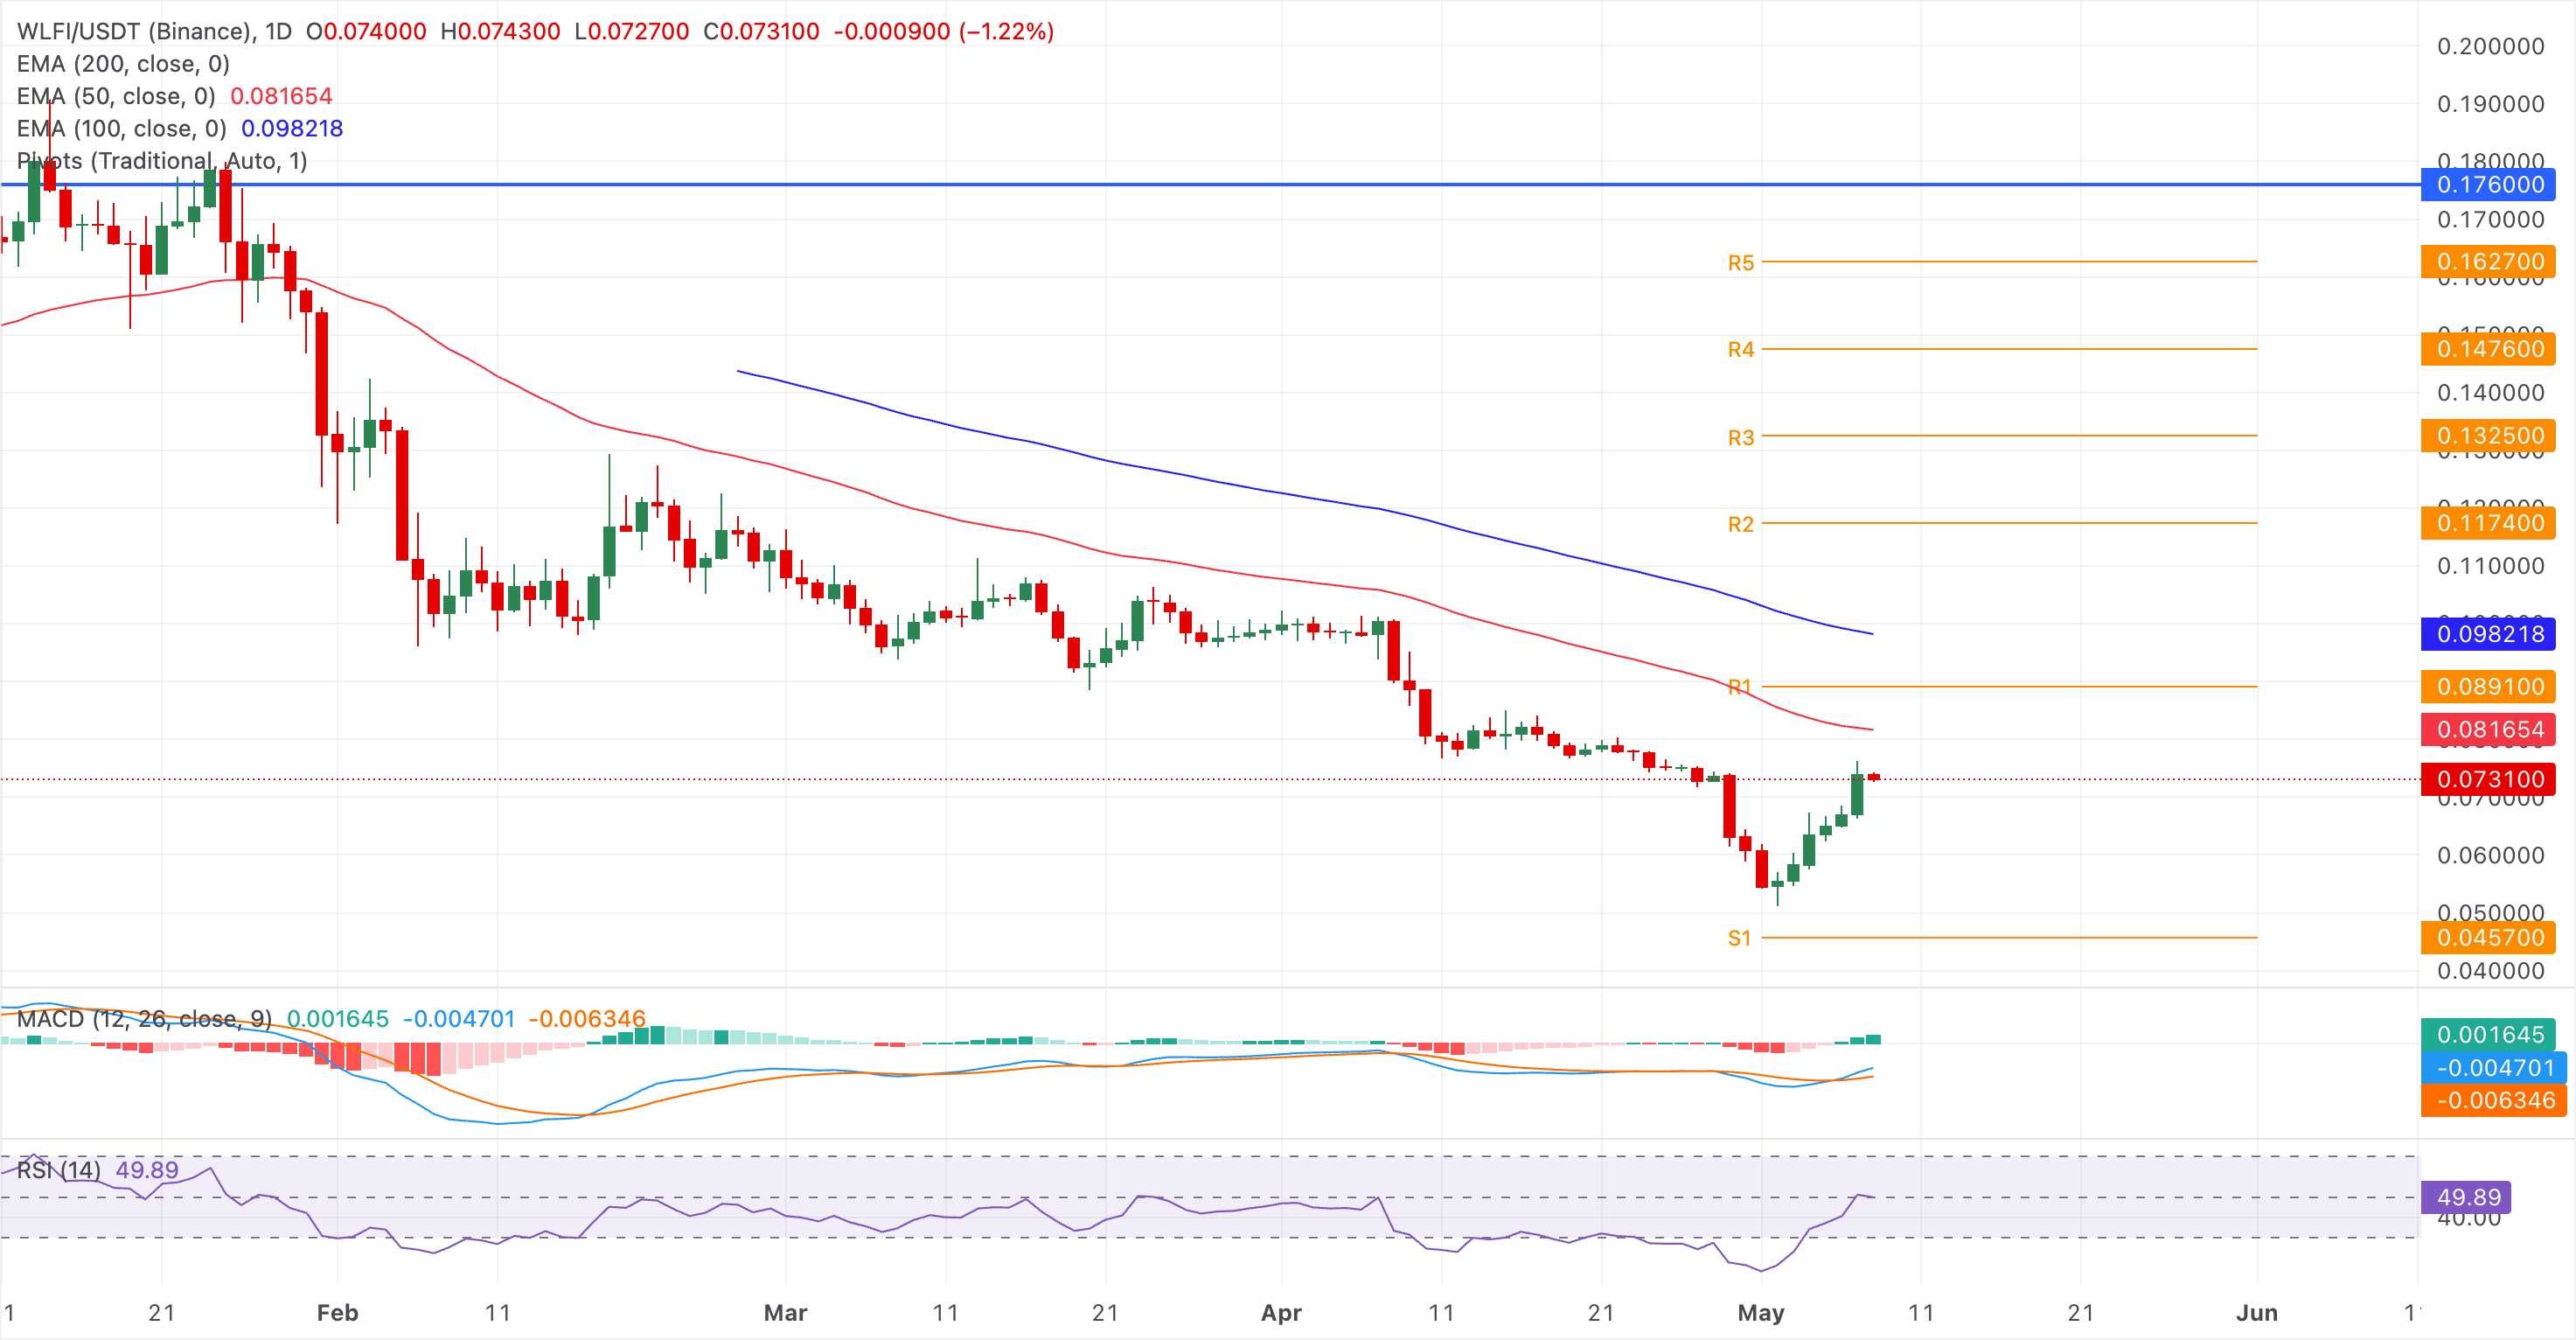
On the flip side, the S1 Pivot Point remains a crucial support level at $0.0457.
Virtuals Protocol is trading above $0.9000 at press time on Friday, extending its fourth straight day of recovery. VIRTUAL reflects a strong bullish phase crossing above the 50-day, 100-day, and 200-day EMAs, which now align as a layered support zone beneath the market.
The RSI near 77 signals overbought conditions, while the positive MACD histogram continues to expand, suggesting that upside momentum remains firm even as the risk of a corrective pause grows.
On the downside, initial support is seen around the session reference near the 200-day EMA at $0.8481, providing a deeper safety net. Further below, the 100-day EMA at roughly $0.74 and the 50-day EMA near $0.72 form a broader demand band that would be expected to attract dip-buying interest if a pullback develops from current elevated levels.
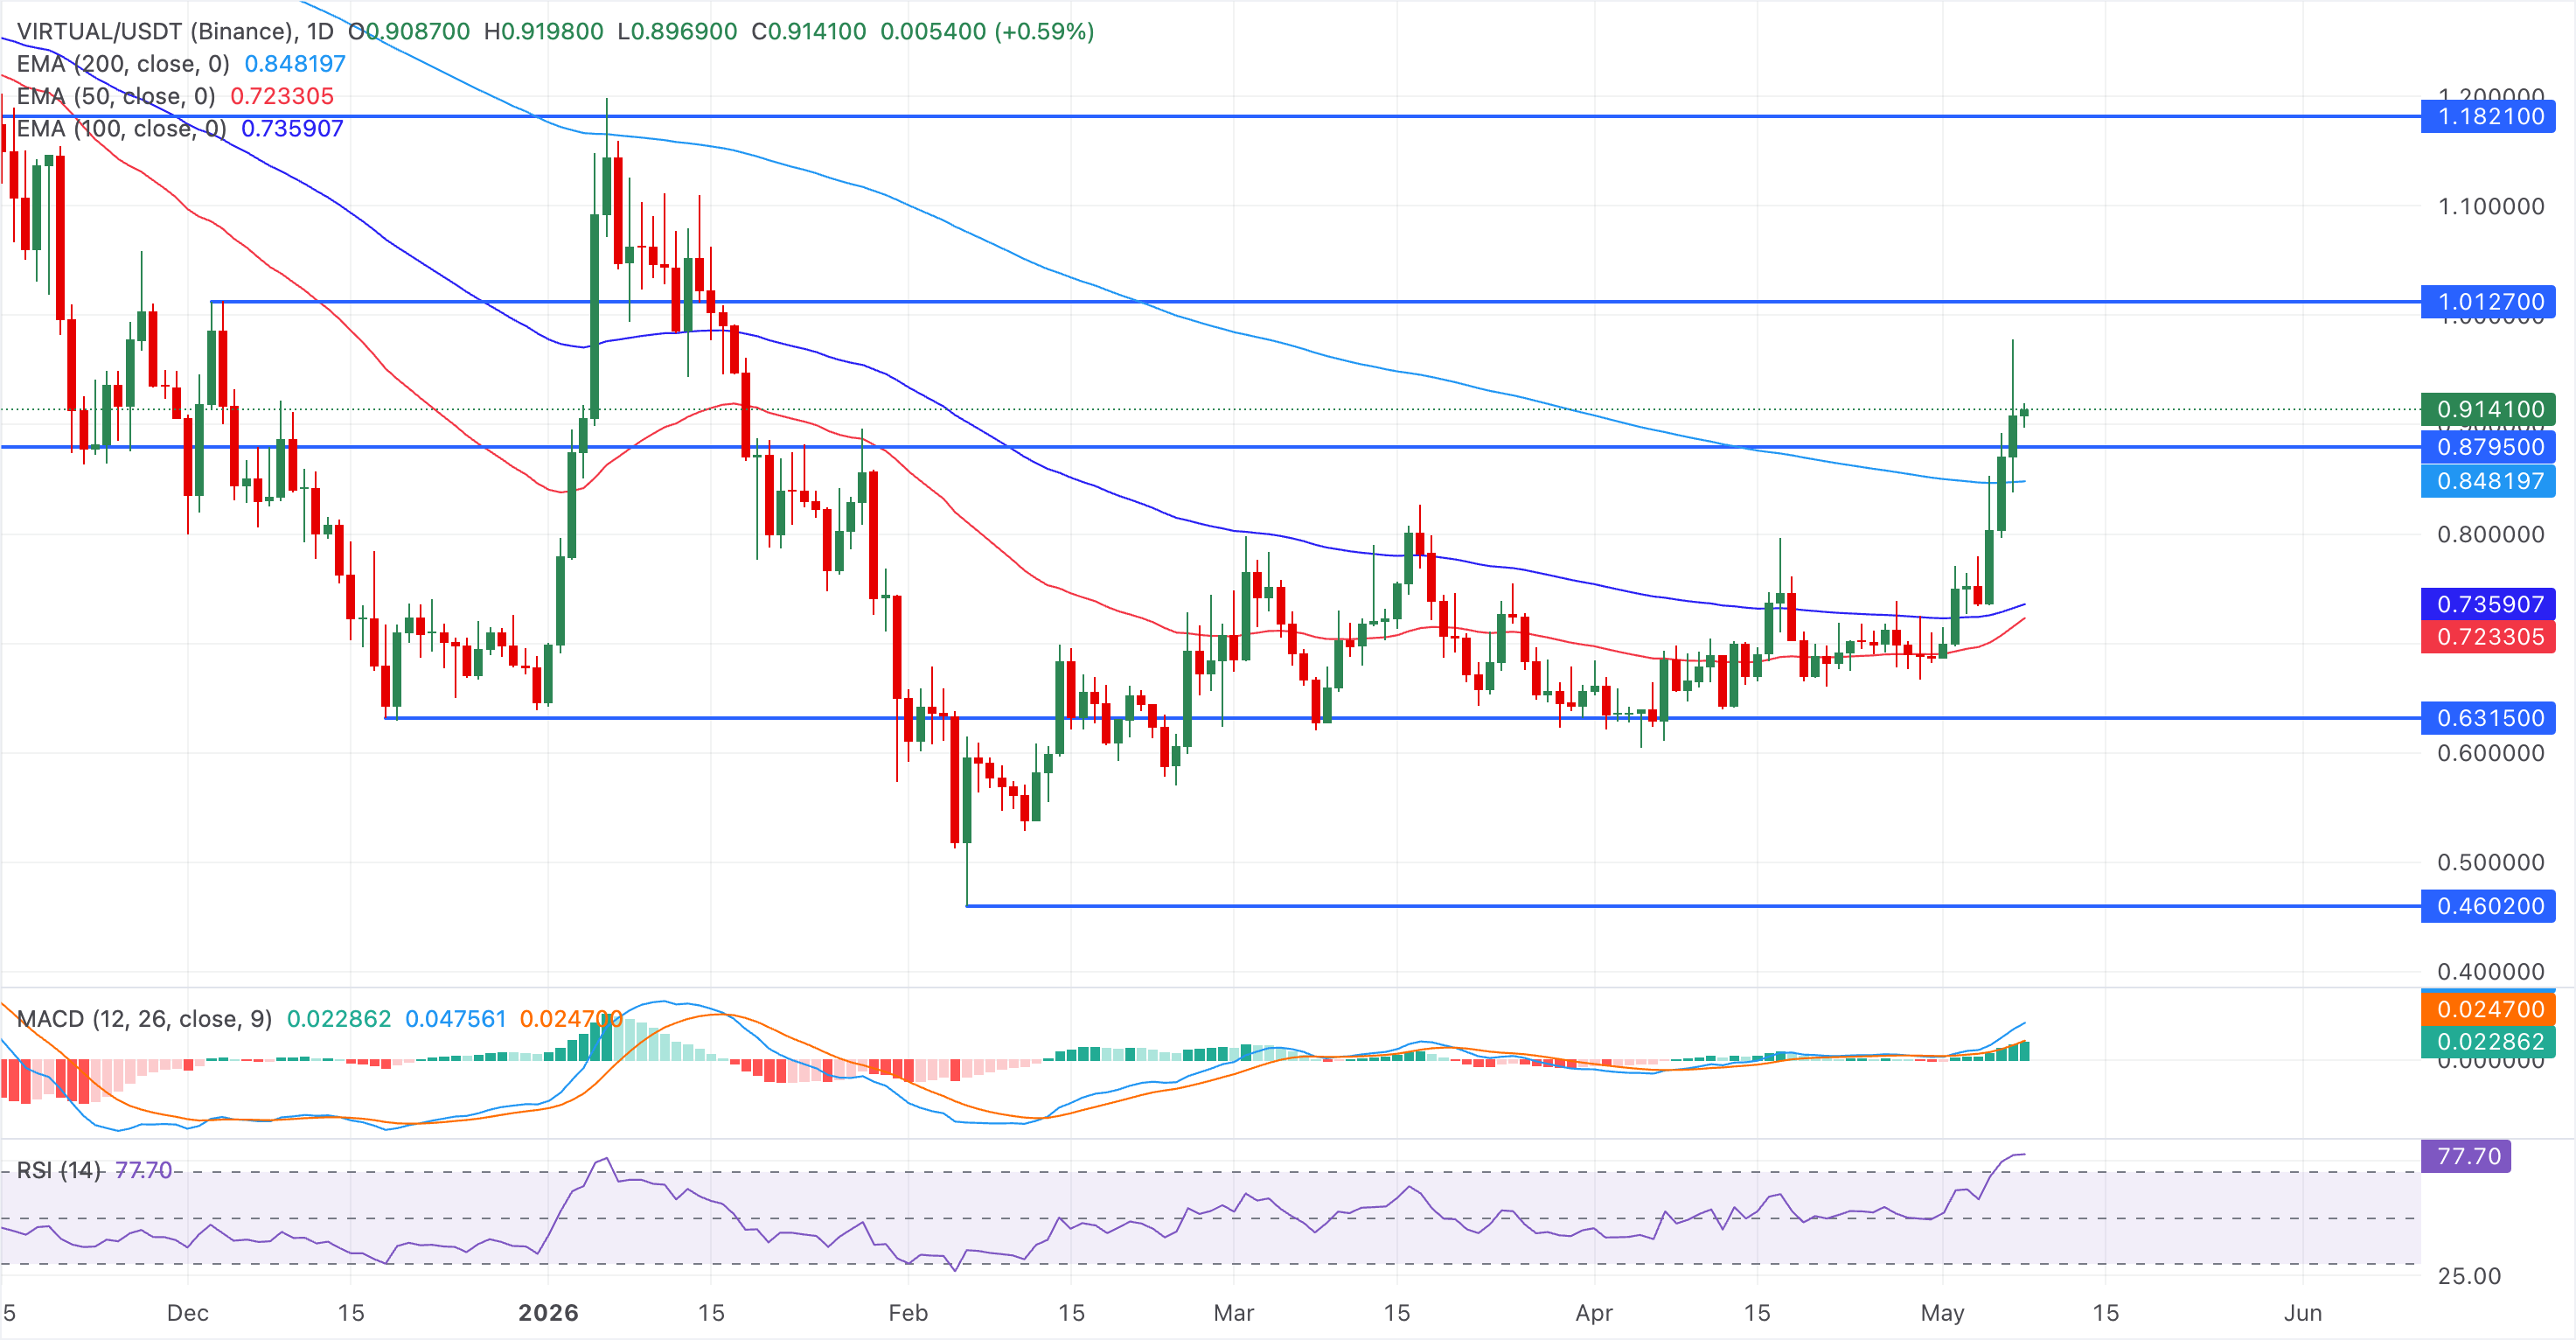
Looking up, the $1.00 psychological threshold remains a key resistance level. A break above this level could extend the rally toward $1.1821.
(The technical analysis of this story was written with the help of an AI tool.)

超過一百萬用戶依賴 FXStreet 獲取即時市場數據、圖表工具、專家洞見與外匯新聞。其全面的經濟日曆與教育網路研討會協助交易者保持資訊領先、做出審慎決策。FXStreet 擁有約 60 人的團隊,分布於巴塞隆納總部及全球各地。
閱讀更多


