

Crypto Today: Bitcoin, Ethereum, XRP rise after defending key support amid renewed Middle East tensions
- Bitcoin rises and tests short-term resistance at $63,000 as the US and Iran continue to exchange fire.
- Ethereum eyes a steady recovery, likely culminating in a breakout above the upper resistance level at $1,800.
- XRP trades in a constrained technical structure, defined by falling moving averages and the Parabolic SAR support at $1.03.
Cryptocurrency prices are broadly rebounding on Thursday, following a dominant sell-off largely attributed to geopolitical tensions in the Middle East. Bitcoin (BTC) has risen and trades near $63,000, while Ethereum (ETH) pares losses around $1,750 as bulls aim for a short-term breakout above $1,800.
Meanwhile, despite Ripple’s (XRP) broader bearish outlook, the remittance token trades near $1.10 resistance, up from its short-term support range between $1.05 and $1.07.

Crypto sentiment dampens amid mounting geopolitical tensions
The United States (US) and Iran continued to launch attacks at each other for the second consecutive day on Thursday, amid mounting pressure on the fragile ceasefire between the two countries, according to a CNN report.
The US military said it hit 90 targets along the Iranian coast overnight. In retaliation, Iran’s Revolutionary Guard reported that they launched attacks on US military bases in Kuwait and Bahrain.
US President Donald Trump has issued a warning that attacks could “get much worse” if Iran continues to strike ships transiting through the Strait of Hormuz. The CNN report added that an Iranian top negotiator said that the strait “will only open with ‘Iranian arrangements,’ not American threats.”
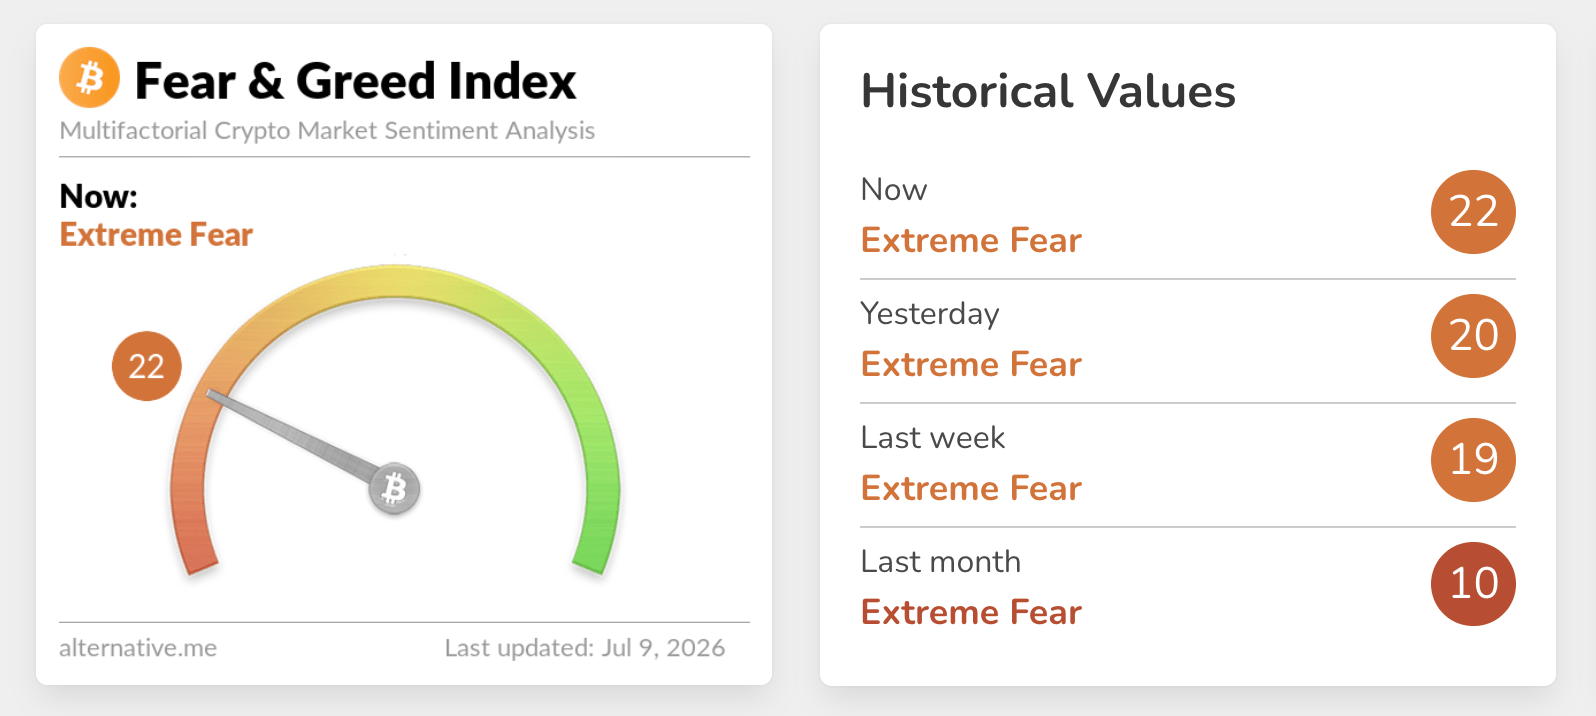
Sentiment in the broader crypto market remains constrained, as wars rarely favor risk assets. The Fear & Greed Index is embedded in the Extreme Fear territory at 22 on Thursday, up only marginally from 20 the day before. This indicates that risk appetite is on the back foot, with investors preferring to stay on the sidelines until geopolitical tensions stabilize. Therefore, recoveries are unlikely to make notable progress in the short term.
Price analysis: Bitcoin rebounds but struggles to build momentum
Bitcoin retains a capped tone as it holds well beneath the 50-day, 100-day and 200-day Exponential Moving Averages (EMAs). Still, the recent reclaim of the downward resistance trendline, whose break area now comes in near $58,689, suggests bears are losing some immediate control.
At the same time, the Relative Strength Index (RSI) hovering just below the midline and a positive Moving Average Convergence Divergence (MACD) histogram together hint that downside momentum is fading rather than accelerating.
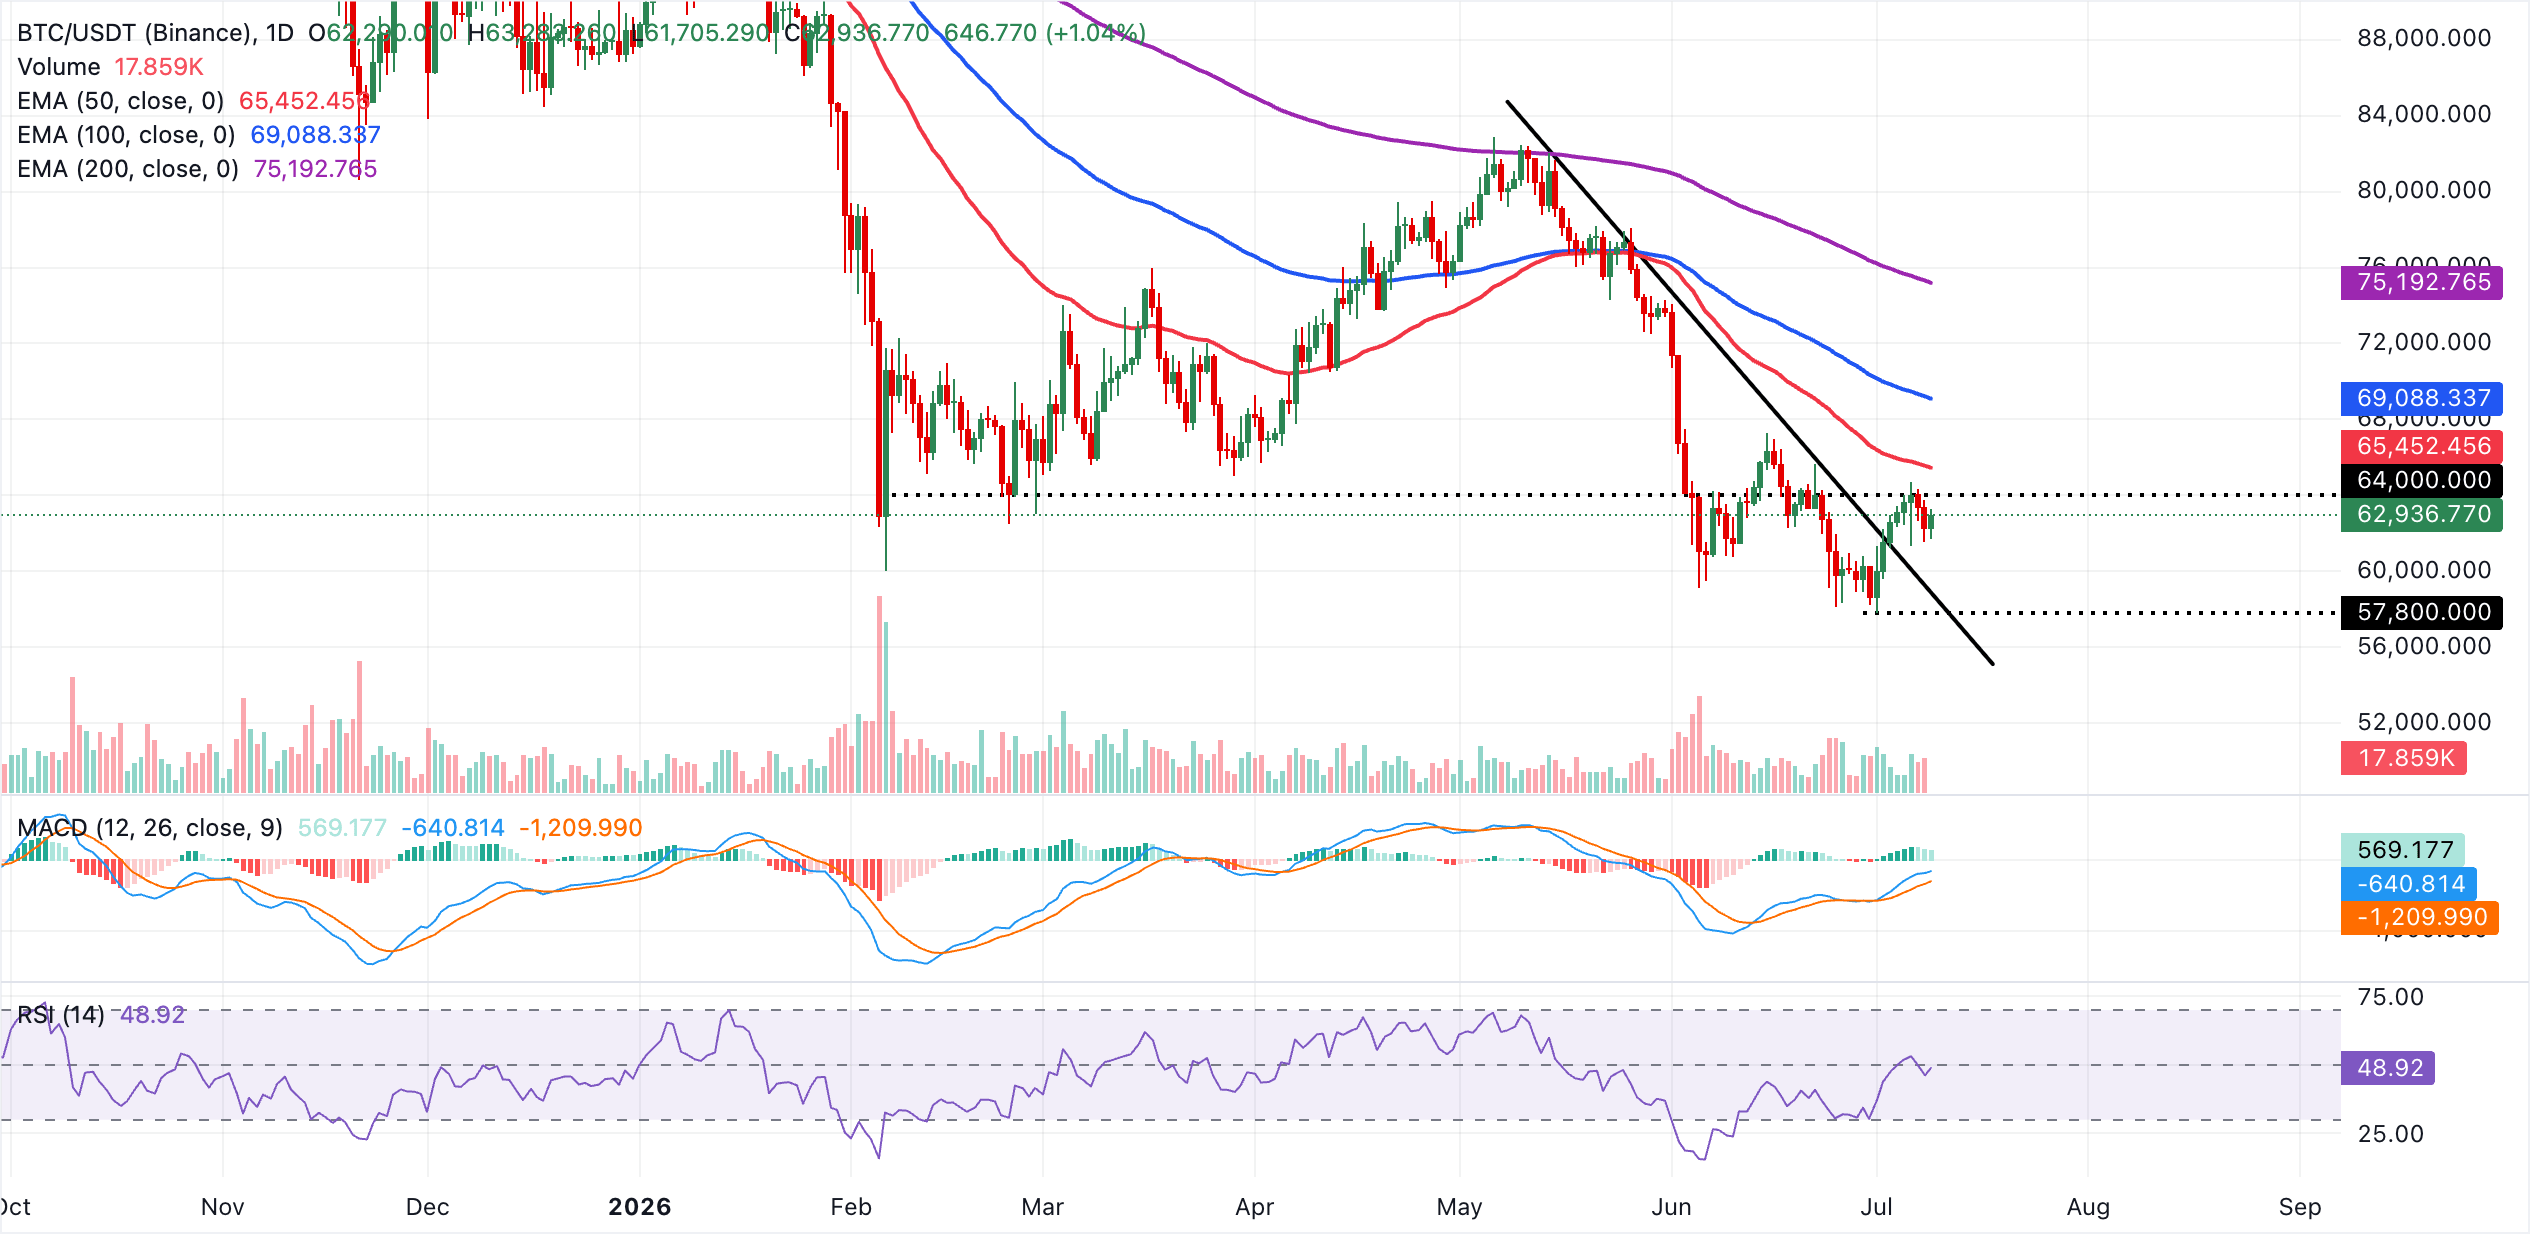
Initial resistance is aligned with the 50-day EMA at around $65,452, followed by the 100-day EMA at approximately $69,089, with the 200-day EMA near $75,193 forming a more strategic barrier that would need to be overcome to revive a broader bullish trend.
On the downside, the first meaningful cushion is seen around the descending resistance line, now acting as support near $58,689. A sustained drop back through this zone would re-open room for a deeper corrective phase toward the psychological $60,000 level, while holding above it keeps scope for further consolidation beneath the overhead EMA cluster.
Altcoins technical outlook: Ethereum and XRP hold key support levels
Ethereum sits above $1,700 while still capped beneath a dense layer of moving averages, keeping the near-term bias bearish despite improving momentum. Still, the MACD indicator stays in positive territory with the line above the signal and a constructive histogram, while the RSI hovers just above 50, hinting at steady but not aggressive buying interest.
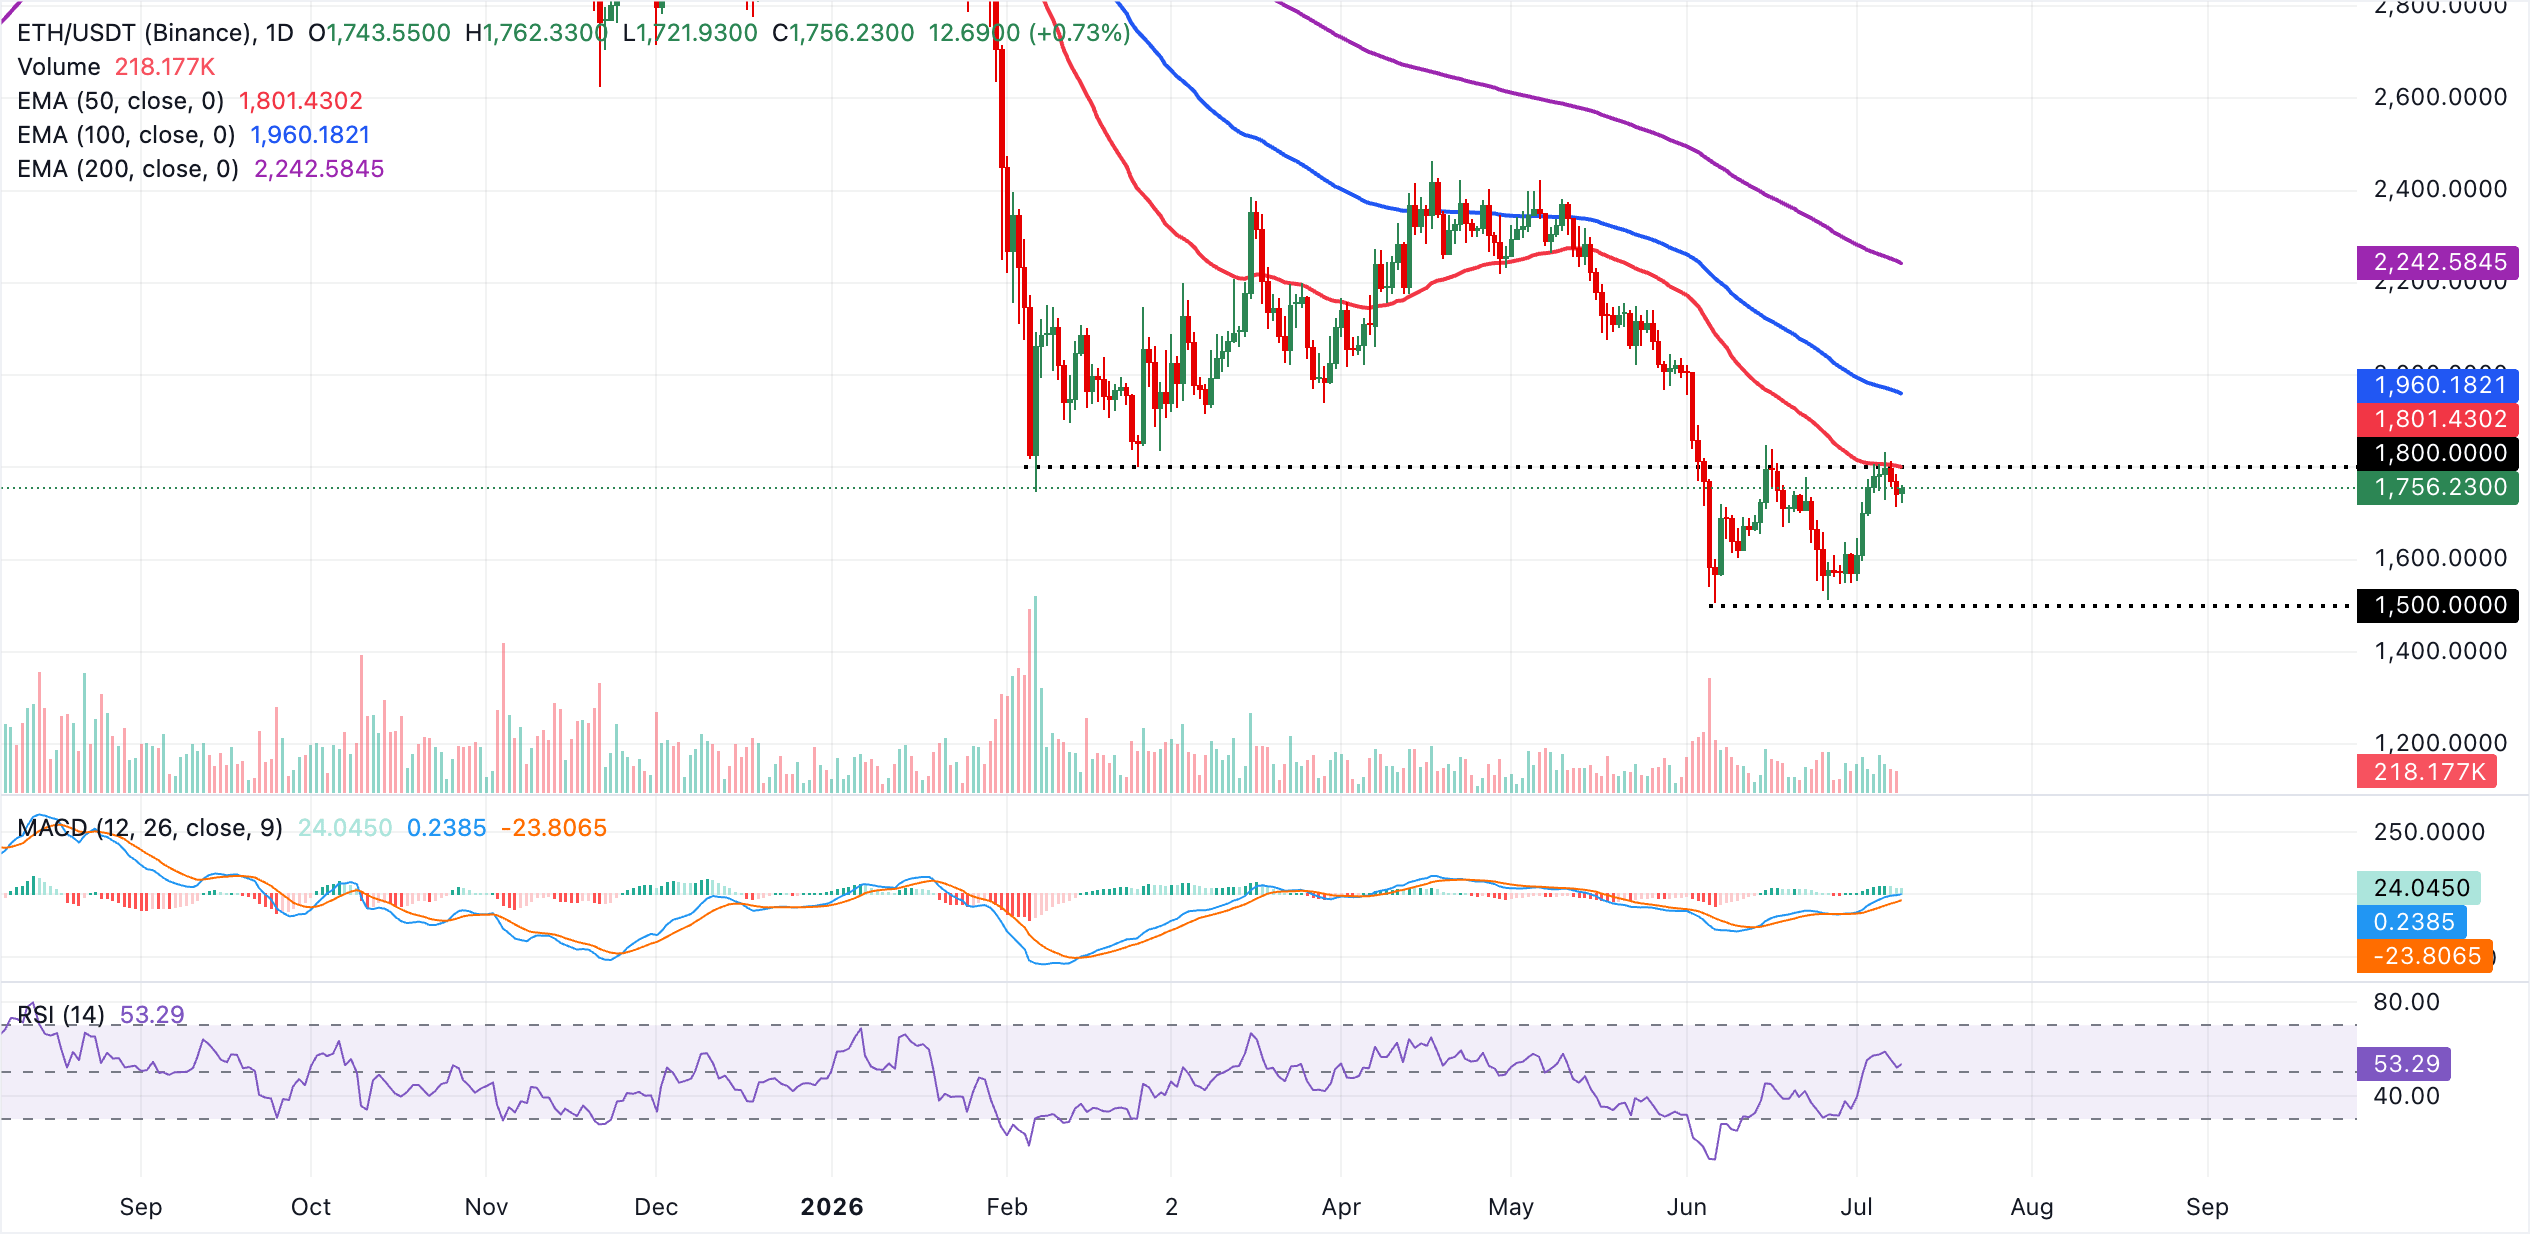
Immediate resistance lies at the 50-day EMA near $1,801, which is the first hurdle bulls must reclaim to extend the recovery. Above that, the 100-day EMA around $1,960 acts as a subsequent barrier, followed by the more significant 200-day EMA close to $2,243 that defines the broader bearish structure. Although there are no nearby technical supports on the daily chart, psychological and prior price lows at $1,700, $1,600 and $1,500 would serve as interim floors. A daily close above the 50-day EMA would be the first signal that selling pressure is starting to ease.
On the other hand, XRP maintains a bearish near-term tone with the spot price well beneath the 50-day, 100-day and the 200-day EMAs. However, the recent rebound from oversold territory is modest, with the RSI hovering in the mid-40s, suggesting only a mild recovery in momentum, while the Parabolic SAR at $1.03 sits below spot and hints at a still-intact but fragile attempt to stabilize after the latest decline.
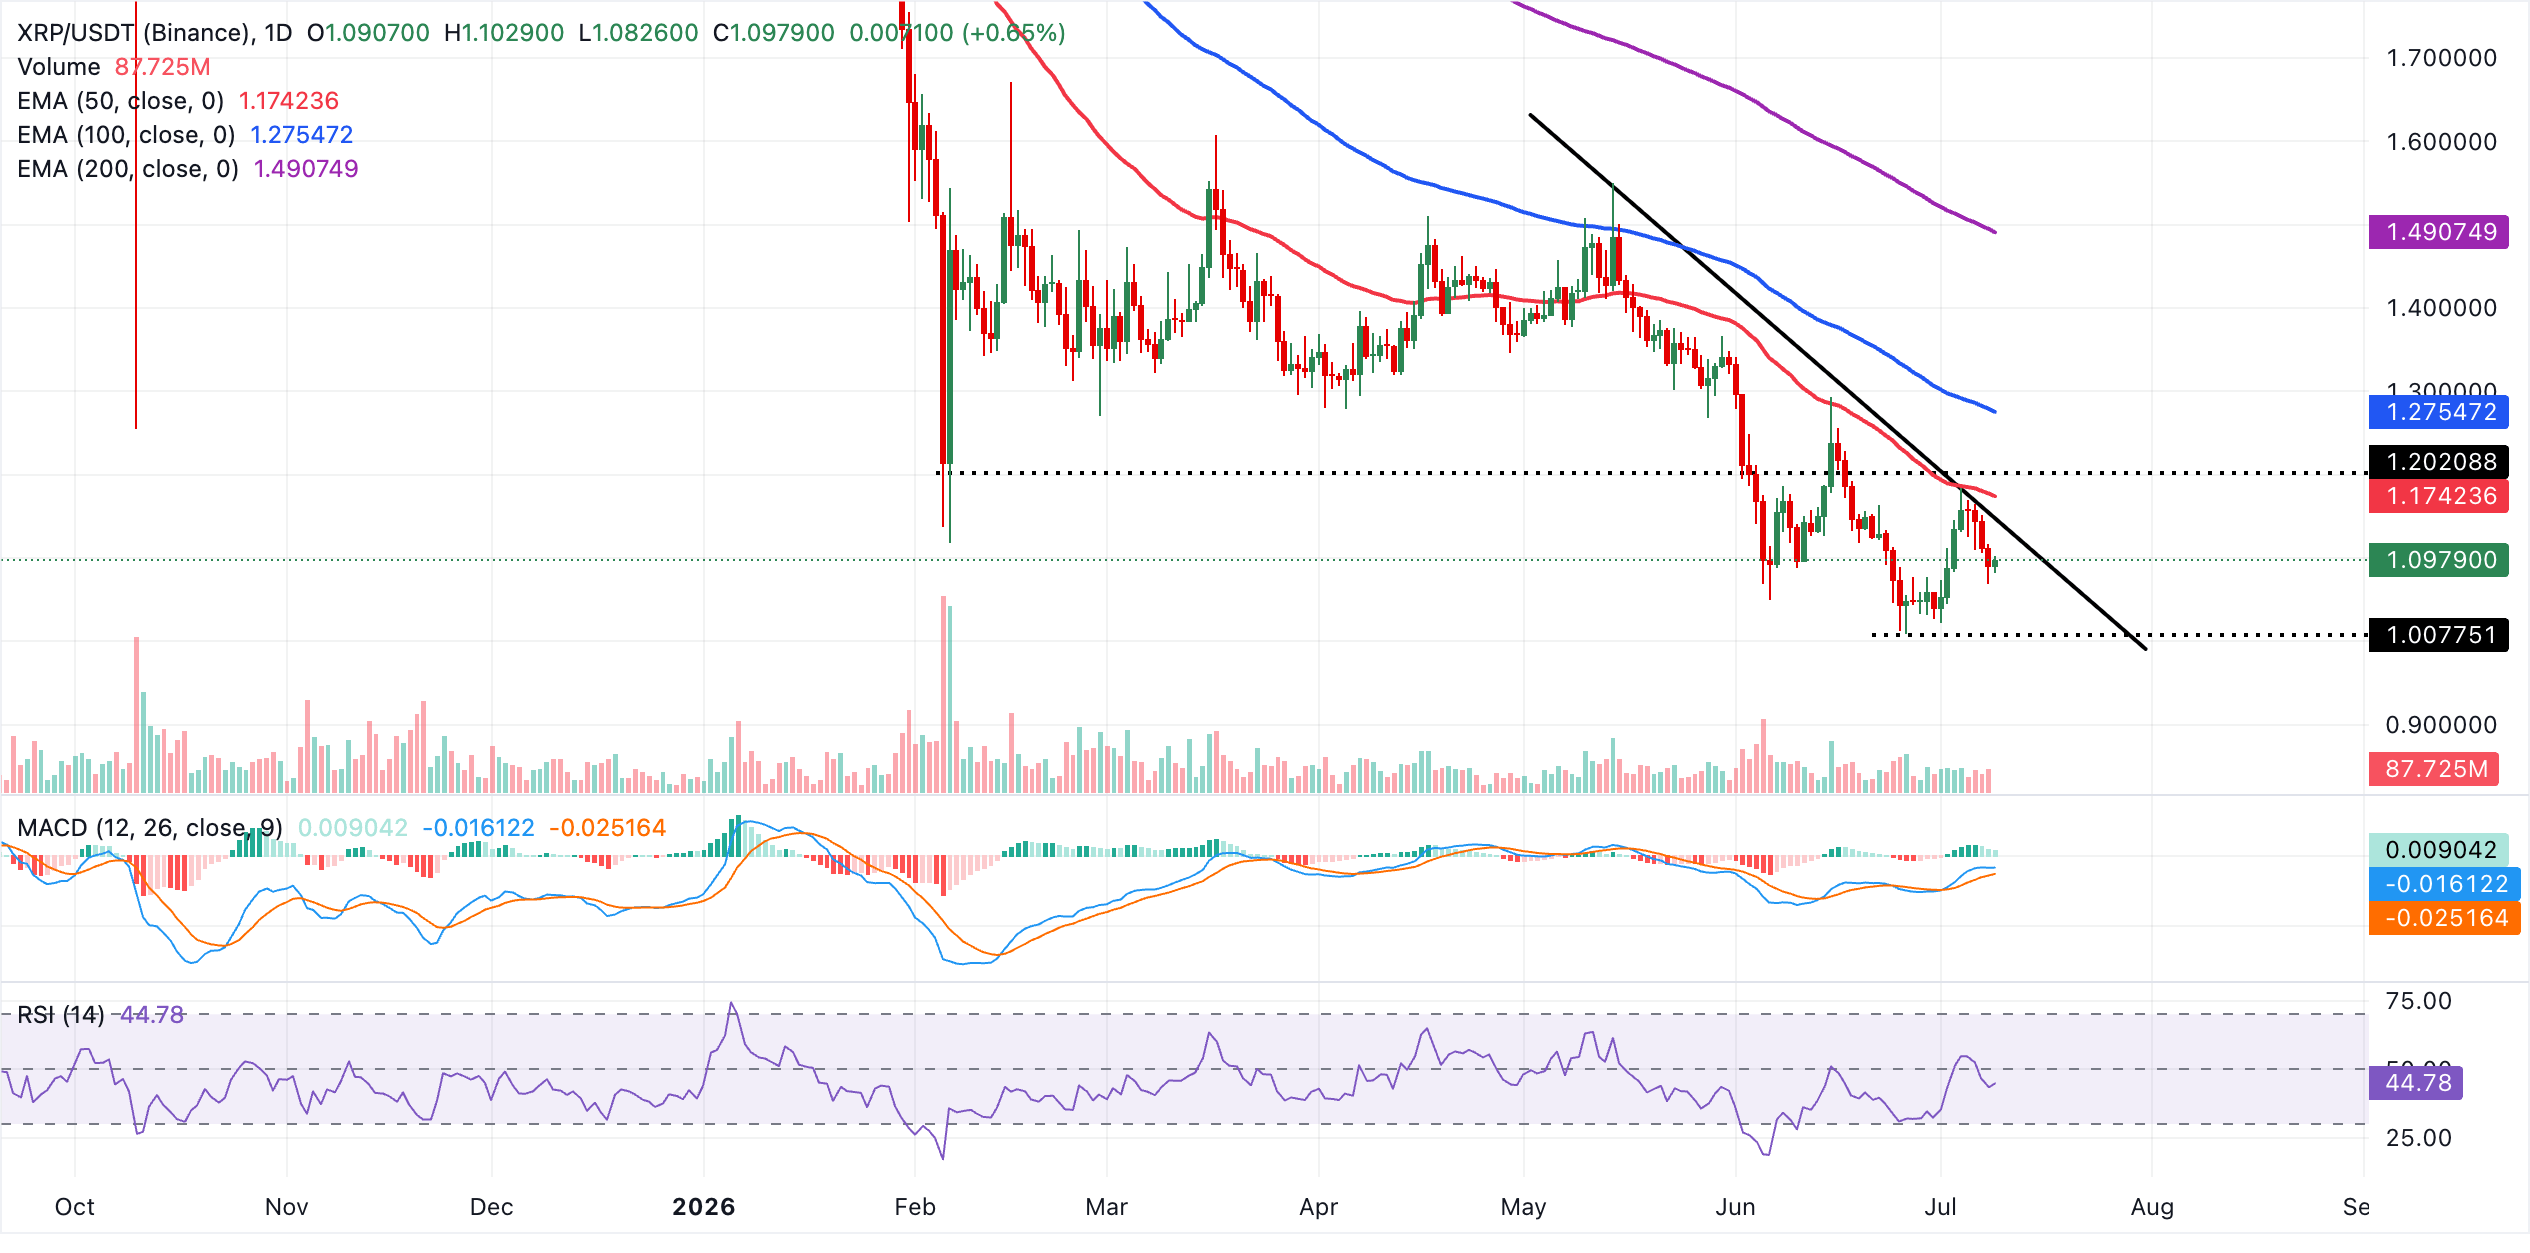
Initial resistance is seen at the descending trendline area near $1.14, followed by the 50-day EMA around $1.17. A daily close above these levels would be needed to ease downside pressure and open the way toward the 100-day EMA at $1.28 and the more distant 200-day EMA near $1.49.
Looking down, the Parabolic SAR at $1.03 marks the first notable layer of support. A break below this level would likely reinstate stronger selling pressure and expose the prior lows on the chart.
(The technical analysis of this story was written with the help of an AI tool. Know more.)
Bitcoin, altcoins, stablecoins FAQs
Bitcoin is the largest cryptocurrency by market capitalization, a virtual currency designed to serve as money. This form of payment cannot be controlled by any one person, group, or entity, which eliminates the need for third-party participation during financial transactions.
Altcoins are any cryptocurrency apart from Bitcoin, but some also regard Ethereum as a non-altcoin because it is from these two cryptocurrencies that forking happens. If this is true, then Litecoin is the first altcoin, forked from the Bitcoin protocol and, therefore, an “improved” version of it.
Stablecoins are cryptocurrencies designed to have a stable price, with their value backed by a reserve of the asset it represents. To achieve this, the value of any one stablecoin is pegged to a commodity or financial instrument, such as the US Dollar (USD), with its supply regulated by an algorithm or demand. The main goal of stablecoins is to provide an on/off-ramp for investors willing to trade and invest in cryptocurrencies. Stablecoins also allow investors to store value since cryptocurrencies, in general, are subject to volatility.
Bitcoin dominance is the ratio of Bitcoin's market capitalization to the total market capitalization of all cryptocurrencies combined. It provides a clear picture of Bitcoin’s interest among investors. A high BTC dominance typically happens before and during a bull run, in which investors resort to investing in relatively stable and high market capitalization cryptocurrency like Bitcoin. A drop in BTC dominance usually means that investors are moving their capital and/or profits to altcoins in a quest for higher returns, which usually triggers an explosion of altcoin rallies.














