
Dogecoin Price Forecast: DOGE eyes breakout as falling wedge and bullish on-chain signals align
作者 Manish Chhetri
發布日期: 23 Dec 2025 | 修改日期: 23 Dec 2025


熱門文章

Dogecoin (DOGE) is trading within a falling wedge pattern at around $0.13 on Tuesday, and a breakout of this pattern favors bulls.
- Dogecoin price trades within a falling wedge pattern on Tuesday, a breakout signals a rally ahead.
- On-chain and derivatives data indicate improving sentiment, with large whale orders, positive funding rates, and rising bullish bets.
- The technical outlook favors an upside move as momentum indicators show fading bearish pressure.
Dogecoin (DOGE) is trading within a falling wedge pattern at around $0.13 on Tuesday, and a breakout of this pattern favors bulls. While broader market conditions still remain mixed, improving on-chain and derivatives signals suggest growing optimism among traders, raising the possibility of an upside breakout if momentum continues to build.
Dogecoin’s onchain and derivatives data show positive bias
CryptoQuant summary data supports a bullish outlook for DOGE, as both spot and futures markets show large whale orders, cooling conditions, and buy dominance, signaling a potential breakout ahead.

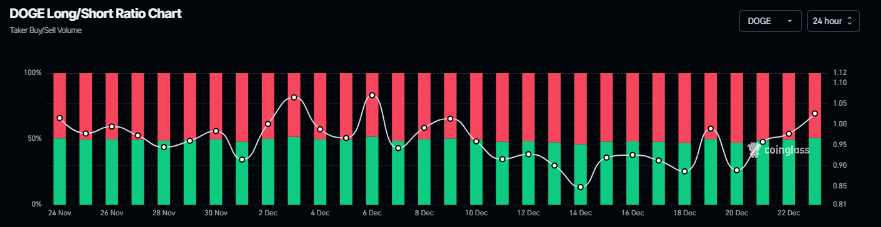
On the derivatives side, Coinglass’s long-to-short ratio for DOGE reads 1.02 on Tuesday, nearing its monthly high. The ratio above one suggests that more traders are betting on the Dogecoin price to rally.
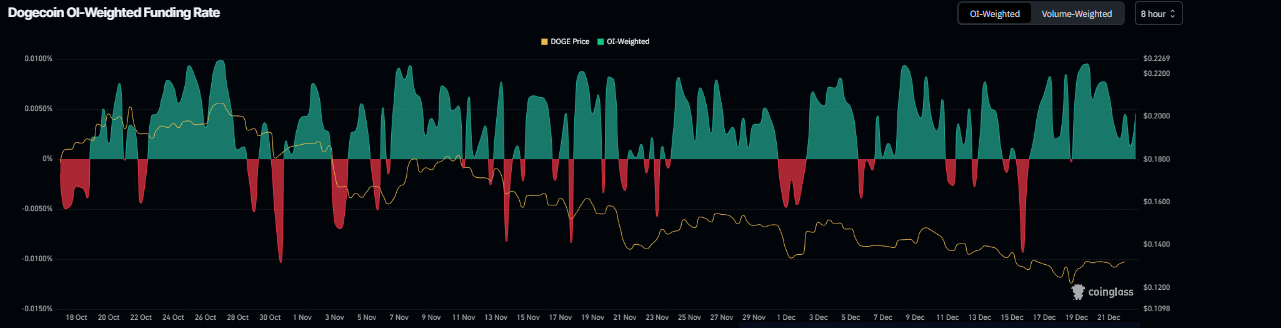
Additionally, Dogecoin’s funding rate data indicate a potential rally. According to Coinglass’s OI-Weighted Funding Rate data, the number of traders betting that the price of DOGE will slide further is lower than those anticipating a price increase.
The metric has flipped to a positive rate on Friday and stands at 0.0045% on Tuesday, indicating that longs are paying shorts. Historically, as shown in the chart below, when the funding rates have flipped from negative to positive, Dogecoin’s price has rallied sharply.
Dogecoin Price Forecast: DOGE could rally if it breaks above the falling wedge pattern
Dogecoin price has been trading within a falling wedge pattern (formed by connecting multiple highs and lows with two trendlines since mid-October). As of writing on Tuesday, DOGE is approaching the upper trendline of the pattern, trading around $0.13.
Suppose DOGE breaks above the falling wedge pattern, which favours a bullish move. It could extend the rally toward the daily resistance at $0.14. A successful close above this could extend additional gains toward the 38.20% Fibonacci retracement level at $0.16.
The Relative Strength Index (RSI) on the daily chart reads 43, pointing upward toward the neutral level of 50, indicating fading bearish momentum. For the bullish momentum to be sustained, the RSI must move above the neutral level. Additionally, the Moving Average Convergence Divergence (MACD) crossed above its signal line on Saturday, signaling a bullish crossover and an upward trend ahead.
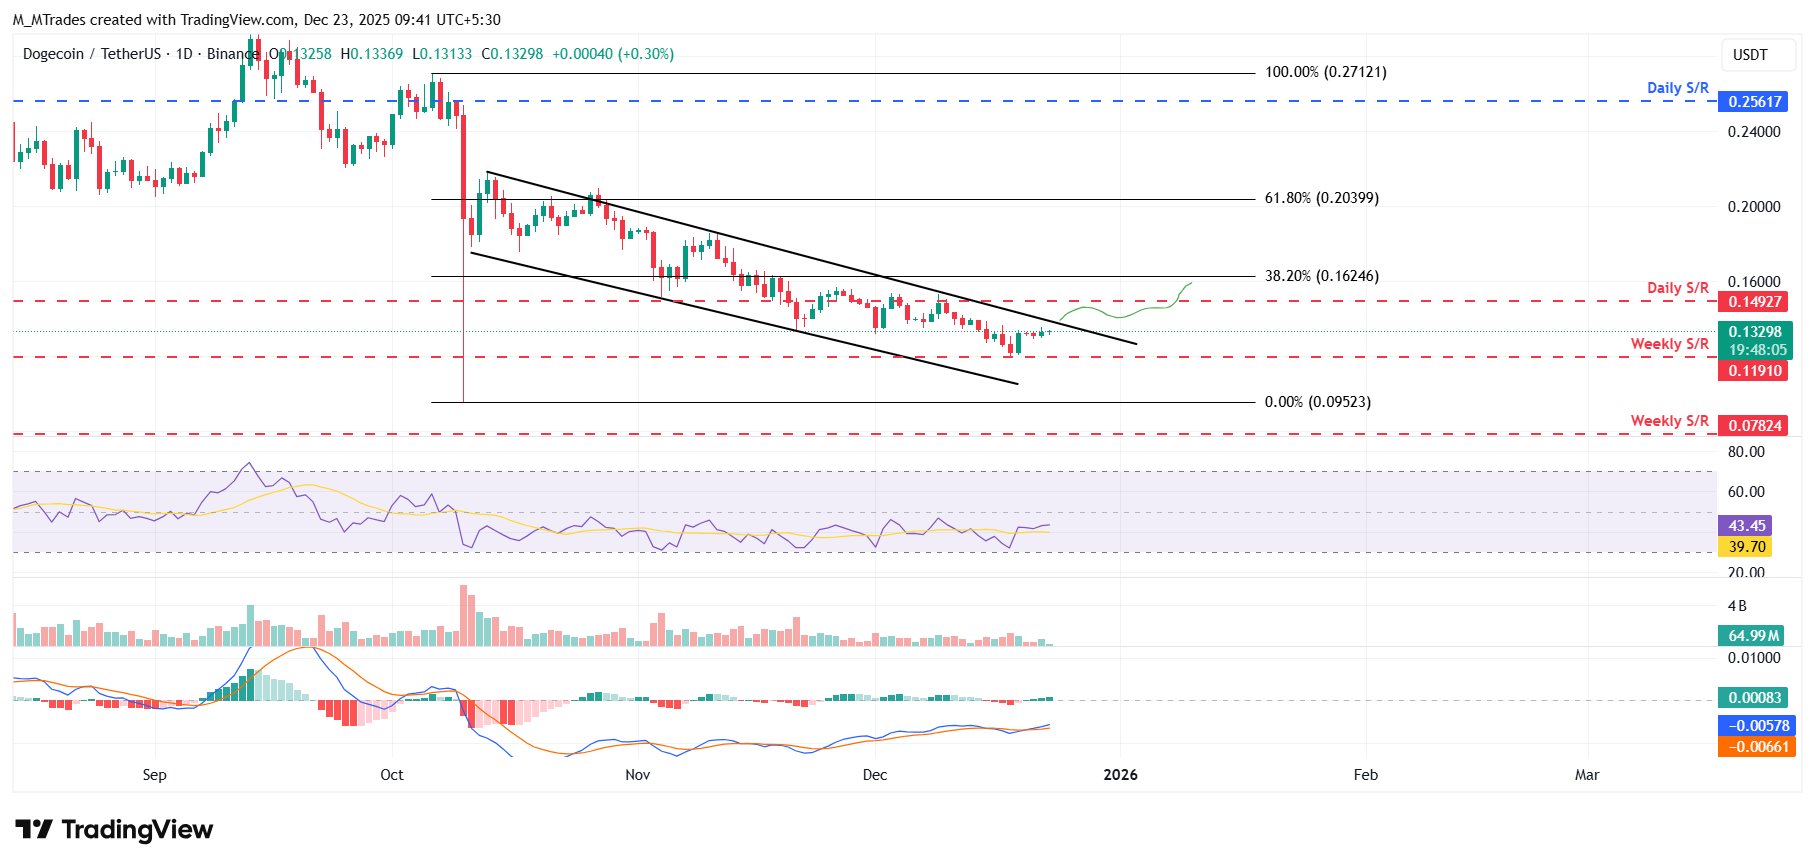
On the other hand, if DOGE faces a correction, it could extend the decline toward the weekly support at $0.11.

超過一百萬用戶依賴 FXStreet 獲取即時市場數據、圖表工具、專家洞見與外匯新聞。其全面的經濟日曆與教育網路研討會協助交易者保持資訊領先、做出審慎決策。FXStreet 擁有約 60 人的團隊,分布於巴塞隆納總部及全球各地。
閱讀更多


