
Ethereum Weekly Price Forecast: EF offloads 10K ETH to BitMine as ETFs break inflow streak
作者 Michael Ebiekutan
更新: 24 Apr 2026


熱門文章

The Ethereum Foundation (EF) announced on Friday that it sold 10,000 ETH at an average price of $2,387 via an over-the-counter (OTC) transaction. The Foundation noted that Ethereum treasury firm BitMine Immersion was the counterparty to the transaction.
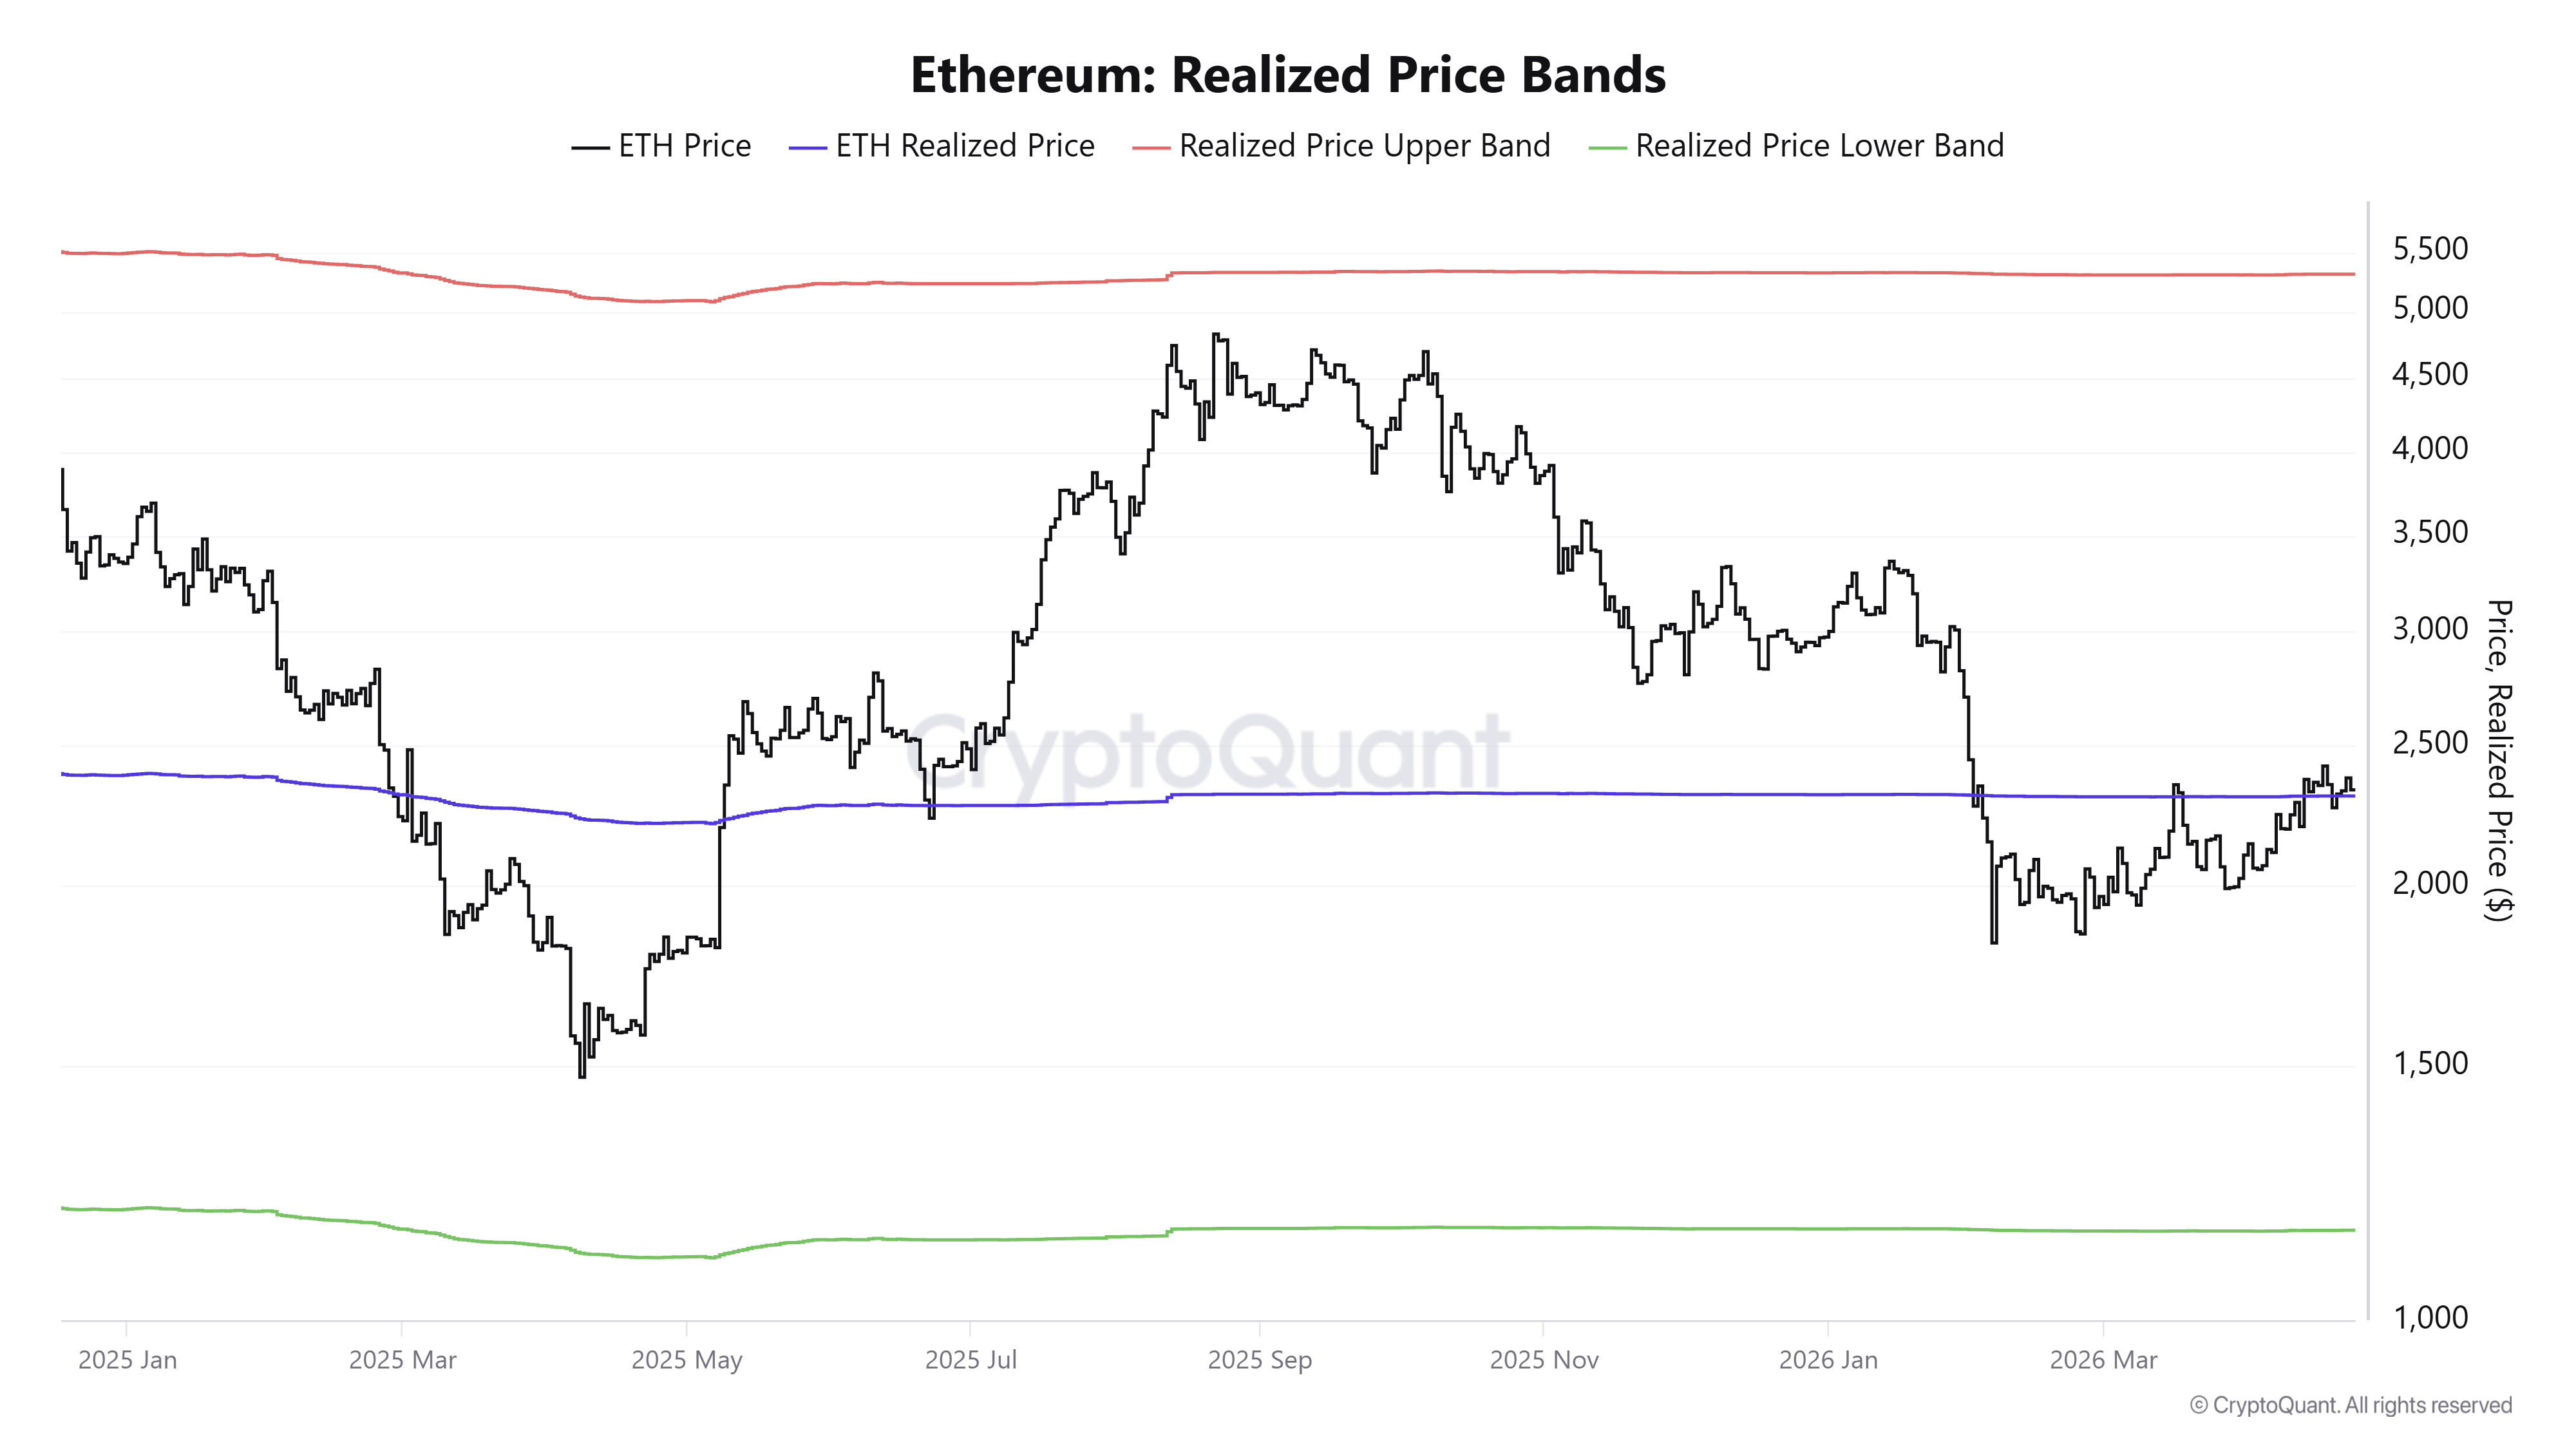
Ethereum price today: $2,320
- The Ethereum Foundation sold 10,000 ETH to BitMine via an OTC transaction.
- Ethereum ETFs ended their 10-day inflow streak after recording $75.9 million in net outflows.
- ETH is retesting a key trendline support, reinforced by the 20-day EMA.
The Ethereum Foundation (EF) announced on Friday that it sold 10,000 ETH at an average price of $2,387 via an over-the-counter (OTC) transaction. The Foundation noted that Ethereum treasury firm BitMine Immersion was the counterparty to the transaction.
"This sale funds the EF's core operations & activities, including protocol R&D, ecosystem development, community grant funding and more," the EF wrote in a Friday X post.
The Foundation had earlier offloaded 10,000 ETH over the past two months to fund grant programs and ecosystem activities, with half of that figure also sold to BitMine.
The deal adds to BitMine's growing digital asset stash. The firm reported holdings of 4.97 million ETH on Monday after purchasing 101,627 ETH.
Earlier this week, smart money trackers suggested that BitMine bought another 100,000 ETH and staked 93,600 ETH following its Monday update.
Meanwhile, US spot ETH exchange-traded funds (ETFs) broke their inflow streak on Thursday, recording $75.9 million in outflows, per SoSoValue data. The products had earlier recorded ten consecutive days of net inflows from April 9-22.
The outflows come as ETH continues to face pressure near its realized price or average onchain cost basis at $2,308.
Ethereum Price Forecast: ETH retests trendline support
Ethereum saw $26.8 million in liquidations over the past 24 hours, led by $14.4 million in long liquidations, according to Coinglass data.
In the daily chart, ETH holds above the 20- and 50-day Exponential Moving Averages (EMAs) at $2,280 and $2,230, respectively, as well as the rising trendline support near $2,301, which collectively maintain a constructive bullish bias despite the proximity of overhead resistance.
Momentum conditions are moderately supportive, with the 14-day Relative Strength Index (RSI) hovering around 55 and the Stochastic Oscillator (Stoch) near mid-range, suggesting ongoing but not overextended buying interest as price consolidates just under the 100-day EMA at $2,372.
On the downside, initial support is seen at the rising trend line around $2,301, followed by the 20- and 50-day EMAs. A break below these clustered averages would expose the horizontal levels at $2,211 and then $2,107.
On the topside, immediate resistance is located at the 100-day EMA at $2,372, ahead of the horizontal barrier at $2,388. A sustained move above this band would open the way toward the next resistance levels at $2,746 and $3,411.
(The technical analysis of this story was written with the help of an AI tool.)

超過一百萬用戶依賴 FXStreet 獲取即時市場數據、圖表工具、專家洞見與外匯新聞。其全面的經濟日曆與教育網路研討會協助交易者保持資訊領先、做出審慎決策。FXStreet 擁有約 60 人的團隊,分布於巴塞隆納總部及全球各地。
閱讀更多


