
EUR/JPY Price Forecast: Remains below nine-day EMA near 183.50
作者 Akhtar Faruqui
發布日期: 13 Mar 2026 | 修改日期: 13 Mar 2026


熱門文章

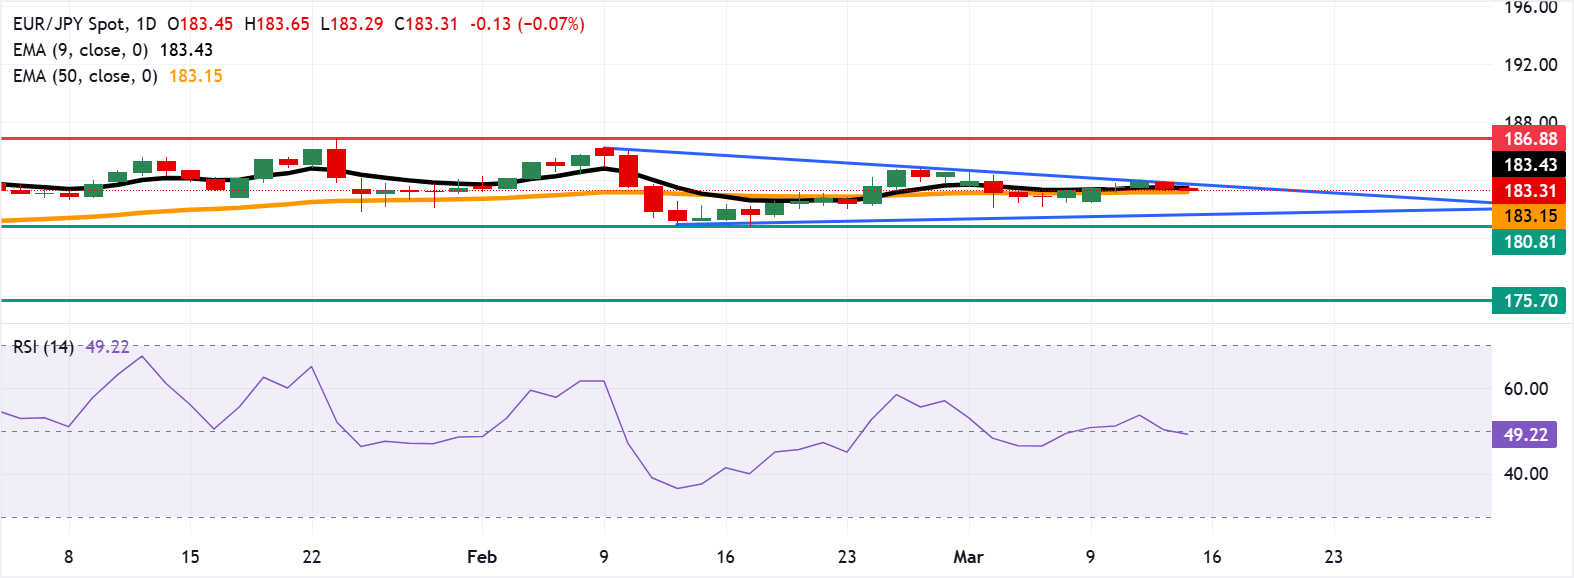
EUR/JPY extends its gains for the second successive session, trading around 183.30 during the Asian hours on Friday. The technical analysis of the daily chart shows the spot testing the upper boundary of a descending triangle, suggesting potential resistance and a possible downside continuation.
- EUR/JPY could test the immediate barrier at the nine-day EMA of 183.43.
- The 14-day Relative Strength Index hovers near 50, signaling neutral momentum.
- Primary support appears at the 50-day EMA of 183.15.
EUR/JPY extends its gains for the second successive session, trading around 183.30 during the Asian hours on Friday. The technical analysis of the daily chart shows the spot testing the upper boundary of a descending triangle, suggesting potential resistance and a possible downside continuation.
The near-term bias is neutral with a mild bullish tilt as price holds above the 50-day Exponential Moving Average (EMA) while the nine-day EMA flattens just above spot, signalling a lack of trend but preserving an upside edge.
The 14-day Relative Strength Index (RSI) hovers near 50, confirming balanced momentum after the recent pullback from last week’s highs, with neither buyers nor sellers in clear control.
The immediate barrier lies at the nine-day EMA of 183.43, followed by the upper boundary of the descending triangle around 183.70. Further advances above the triangle would support the EUR/JPY cross to explore the region around the all-time high of 186.88, reached on January 23.
On the downside, immediate support is seen at the 50-day EMA of 183.15. A break below this level would weaken the medium-term price momentum and expose the lower boundary of a descending triangle around 181.80, followed by the three-month low of 180.81, recorded on February 12. A break below the latter would expose the four-month low at 175.70, recorded on November 5.
(The technical analysis of this story was written with the help of an AI tool.)
Euro Price Today
The table below shows the percentage change of Euro (EUR) against listed major currencies today. Euro was the weakest against the US Dollar.
| USD | EUR | GBP | JPY | CAD | AUD | NZD | CHF | |
|---|---|---|---|---|---|---|---|---|
| USD | 0.07% | 0.07% | 0.02% | 0.03% | 0.17% | 0.43% | 0.13% | |
| EUR | -0.07% | 0.00% | -0.06% | -0.03% | 0.11% | 0.36% | 0.06% | |
| GBP | -0.07% | 0.00% | -0.04% | -0.03% | 0.11% | 0.35% | 0.04% | |
| JPY | -0.02% | 0.06% | 0.04% | 0.02% | 0.15% | 0.39% | 0.08% | |
| CAD | -0.03% | 0.03% | 0.03% | -0.02% | 0.13% | 0.37% | 0.07% | |
| AUD | -0.17% | -0.11% | -0.11% | -0.15% | -0.13% | 0.25% | -0.06% | |
| NZD | -0.43% | -0.36% | -0.35% | -0.39% | -0.37% | -0.25% | -0.32% | |
| CHF | -0.13% | -0.06% | -0.04% | -0.08% | -0.07% | 0.06% | 0.32% |
The heat map shows percentage changes of major currencies against each other. The base currency is picked from the left column, while the quote currency is picked from the top row. For example, if you pick the Euro from the left column and move along the horizontal line to the US Dollar, the percentage change displayed in the box will represent EUR (base)/USD (quote).

超過一百萬用戶依賴 FXStreet 獲取即時市場數據、圖表工具、專家洞見與外匯新聞。其全面的經濟日曆與教育網路研討會協助交易者保持資訊領先、做出審慎決策。FXStreet 擁有約 60 人的團隊,分布於巴塞隆納總部及全球各地。
閱讀更多


