
Forex Today: US Dollar holds ground, focus shifts to Trump-Xi summit
作者 Eren Sengezer
更新: 13 May 2026


熱門文章
Here is what you need to know on Wednesday, May 13:
Here is what you need to know on Wednesday, May 13:
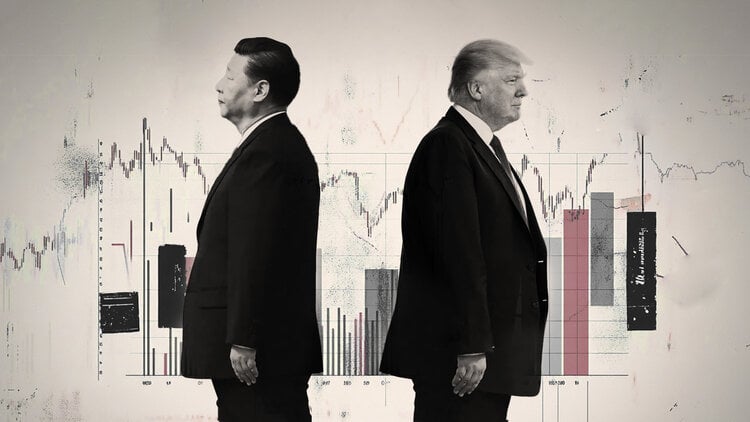
The US Dollar (USD) continues to edge higher early Wednesday after having outperformed its rivals on Tuesday. In the European session, investors will pay close attention to the revision of the first-quarter Gross Domestic Product (GDP) for the Eurozone. Later in the day, the US economic calendar will feature Producer Price Index (PPI) data for April. More importantly, market participants will keep a close eye on headlines coming out of United States (US) President Donald Trump's summit with Chinese President Xi Jinping.
The US Bureau of Labor Statistics reported on Tuesday that annual inflation, as measured by the change in the Consumer Price Index (CPI), climbed to 3.8% in April, surpassing the market expectation of 3.7% and marking the highest print since May 2023. In this period, the core CPI, which excludes volatile food and energy prices, rose 2.8%, compared to the 2.6% increase reported in March and analysts' estimate of 2.7%.
The benchmark 10-year US Treasury bond yield rose to its highest level since late March above 4.46% after the inflation data on Tuesday, and the USD Index gained about 0.4% on the day. In the meantime, Wall Street's main indexes registered large losses. Early Wednesday, the USD Index holds steady at around 98.40, while US stock index futures trade mixed.
US Dollar Price This week
The table below shows the percentage change of US Dollar (USD) against listed major currencies this week. US Dollar was the strongest against the Japanese Yen.
| USD | EUR | GBP | JPY | CAD | AUD | NZD | CHF | |
|---|---|---|---|---|---|---|---|---|
| USD | 0.29% | 0.21% | 0.73% | 0.20% | -0.19% | 0.04% | 0.47% | |
| EUR | -0.29% | -0.09% | 0.50% | -0.11% | -0.49% | -0.30% | 0.16% | |
| GBP | -0.21% | 0.09% | 0.09% | -0.04% | -0.43% | -0.19% | 0.24% | |
| JPY | -0.73% | -0.50% | -0.09% | -0.59% | -0.93% | -0.70% | -0.22% | |
| CAD | -0.20% | 0.11% | 0.04% | 0.59% | -0.29% | -0.11% | 0.26% | |
| AUD | 0.19% | 0.49% | 0.43% | 0.93% | 0.29% | 0.24% | 0.66% | |
| NZD | -0.04% | 0.30% | 0.19% | 0.70% | 0.11% | -0.24% | 0.41% | |
| CHF | -0.47% | -0.16% | -0.24% | 0.22% | -0.26% | -0.66% | -0.41% |
The heat map shows percentage changes of major currencies against each other. The base currency is picked from the left column, while the quote currency is picked from the top row. For example, if you pick the US Dollar from the left column and move along the horizontal line to the Japanese Yen, the percentage change displayed in the box will represent USD (base)/JPY (quote).
Gold (XAU/USD) fluctuated in a wide range on Tuesday as it recovered above $4,700 late in the American session to close the day with small losses after dropping below $4,640 during the European trading hours. XAU/USD stays relatively quiet midweek and moves sidewas slightly above $4,700.
EUR/USD stays on the back foot and trades in negative territory below 1.1730 after losing about 0.4% on Tuesday. European Central Bank (ECB) Governing Council member François Villeroy de Galhau said on Wednesday that they don't have enough information on core inflation yet but added that the ECB must be ready to intervene to address second round effects.
In addition to the broad USD strength, the selling pressure surrounding the British Pound caused GBP/USD decline sharply on Tuesday. UK Prime Minister Keir Starmer is facing growing calls for his resignation after four ministers have resigned from the government and more than 80 lawmakers reportedly called for him to either quit or set a timetable for his departure.
USD/JPY stays in a consolidation phase above 157.50 after posting moderate gains on Tuesday.
Inflation FAQs
Inflation measures the rise in the price of a representative basket of goods and services. Headline inflation is usually expressed as a percentage change on a month-on-month (MoM) and year-on-year (YoY) basis. Core inflation excludes more volatile elements such as food and fuel which can fluctuate because of geopolitical and seasonal factors. Core inflation is the figure economists focus on and is the level targeted by central banks, which are mandated to keep inflation at a manageable level, usually around 2%.
The Consumer Price Index (CPI) measures the change in prices of a basket of goods and services over a period of time. It is usually expressed as a percentage change on a month-on-month (MoM) and year-on-year (YoY) basis. Core CPI is the figure targeted by central banks as it excludes volatile food and fuel inputs. When Core CPI rises above 2% it usually results in higher interest rates and vice versa when it falls below 2%. Since higher interest rates are positive for a currency, higher inflation usually results in a stronger currency. The opposite is true when inflation falls.
Although it may seem counter-intuitive, high inflation in a country pushes up the value of its currency and vice versa for lower inflation. This is because the central bank will normally raise interest rates to combat the higher inflation, which attract more global capital inflows from investors looking for a lucrative place to park their money.
Formerly, Gold was the asset investors turned to in times of high inflation because it preserved its value, and whilst investors will often still buy Gold for its safe-haven properties in times of extreme market turmoil, this is not the case most of the time. This is because when inflation is high, central banks will put up interest rates to combat it. Higher interest rates are negative for Gold because they increase the opportunity-cost of holding Gold vis-a-vis an interest-bearing asset or placing the money in a cash deposit account. On the flipside, lower inflation tends to be positive for Gold as it brings interest rates down, making the bright metal a more viable investment alternative.

超過一百萬用戶依賴 FXStreet 獲取即時市場數據、圖表工具、專家洞見與外匯新聞。其全面的經濟日曆與教育網路研討會協助交易者保持資訊領先、做出審慎決策。FXStreet 擁有約 60 人的團隊,分布於巴塞隆納總部及全球各地。
閱讀更多


