
GBP/JPY Price Forecast: Breaks below 213.00 eyes on 212.00
作者 Christian Borjon Valencia
更新: 6 May 2026


熱門文章

GBP/JPY retreats over 0.55% on Wednesday as the Japanese Yen strengthened in the aftermath of last week’s intervention in the FX markets by Japanese authorities. At the time of writing, the cross-pair trades at 212.60 after reaching a daily peak of 214.23.
- GBP/JPY retreats after failing near 214.00 amid stronger Japanese Yen.
- RSI points lower, signaling growing downside momentum in near term.
- Break below 212.04 exposes 210.46 and 209.63 support levels.
GBP/JPY retreats over 0.55% on Wednesday as the Japanese Yen strengthened in the aftermath of last week’s intervention in the FX markets by Japanese authorities. At the time of writing, the cross-pair trades at 212.60 after reaching a daily peak of 214.23.
GBP/JPY Price Forecast: Technical Outlook
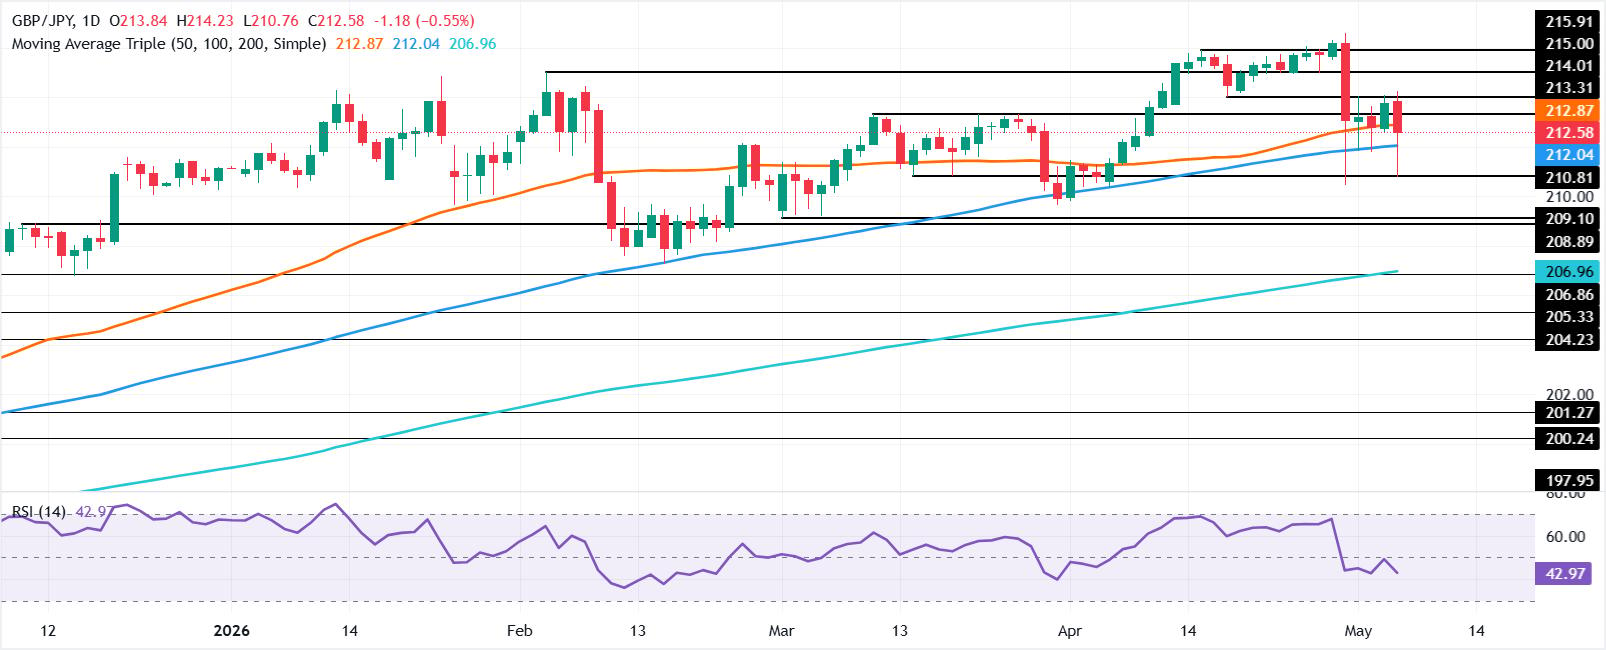
The GBP/JPY is poised to consolidate after clearing key support levels like the 50-day Simple Moving Average (SMA) at 211.99, followed by the 50-day SMA at 212.85.
Momentum favours further upside, as depicted in the daily chart, but the Relative Strength Index (RSI) hints that further downside is seen.
If GBP/JPY drops below the 100-day SMA of 212.04, the cross would resume its downtrend sharply, with the next support seen at 210.46, the April 30 swing low. A breach of the latter will expose the March 31 swing low of 209.63, followed by the March 5 low of 209.18.
Conversely, the first resistance for GBP/JPY is the 50-day SMA at 212.91. A decisive break will expose the 213.00 figure, followed by the 214.00, with buyers eyeing the 20-day SMA at 214.63.
GBP/JPY Price Chart – Daily
Japanese Yen Price Today
The table below shows the percentage change of Japanese Yen (JPY) against listed major currencies today. Japanese Yen was the strongest against the Canadian Dollar.
| USD | EUR | GBP | JPY | CAD | AUD | NZD | CHF | |
|---|---|---|---|---|---|---|---|---|
| USD | -0.46% | -0.40% | -1.00% | 0.08% | -0.75% | -1.24% | -0.51% | |
| EUR | 0.46% | 0.05% | -0.51% | 0.55% | -0.29% | -0.88% | -0.07% | |
| GBP | 0.40% | -0.05% | -0.59% | 0.50% | -0.35% | -0.92% | -0.09% | |
| JPY | 1.00% | 0.51% | 0.59% | 1.06% | 0.20% | -0.18% | 0.41% | |
| CAD | -0.08% | -0.55% | -0.50% | -1.06% | -0.85% | -1.26% | -0.57% | |
| AUD | 0.75% | 0.29% | 0.35% | -0.20% | 0.85% | -0.56% | 0.26% | |
| NZD | 1.24% | 0.88% | 0.92% | 0.18% | 1.26% | 0.56% | 0.78% | |
| CHF | 0.51% | 0.07% | 0.09% | -0.41% | 0.57% | -0.26% | -0.78% |
The heat map shows percentage changes of major currencies against each other. The base currency is picked from the left column, while the quote currency is picked from the top row. For example, if you pick the Japanese Yen from the left column and move along the horizontal line to the US Dollar, the percentage change displayed in the box will represent JPY (base)/USD (quote).

超過一百萬用戶依賴 FXStreet 獲取即時市場數據、圖表工具、專家洞見與外匯新聞。其全面的經濟日曆與教育網路研討會協助交易者保持資訊領先、做出審慎決策。FXStreet 擁有約 60 人的團隊,分布於巴塞隆納總部及全球各地。
閱讀更多


