
GBP/USD Price Forecast: Pound hesitates around 1.3450 amid geopolitical woes
作者 Guillermo Alcala
更新: 1 Jun 2026


熱門文章
The British Pound (GBP) remains practically flat against the US Dollar (USD) on Monday, trading both sides of the 1.3450 level, with investors wary of taking excessive risks.
- GBP/USD is looking for direction around 1.3450 amid a cautious market mood.
- Rising US-Iran tensions are weighing on risk appetite on Monday.
- The pair is forming a triangle pattern with a bearish outcome favoured.
The British Pound (GBP) remains practically flat against the US Dollar (USD) on Monday, trading both sides of the 1.3450 level, with investors wary of taking excessive risks. Growing tensions in the Middle East are weighing on risk appetite while USD rallies remain subdued, ahead of a string of key fundamental releases in the US.
A further escalation of the tensions between the US and Iran and the extension of Israel’s occupation in Lebanon have prompted retaliation pledges by Iranian authorities, casting shadows over an already frail ceasefire. US President Donald Trump is still due to sign a memorandum of understanding that would extend the ceasefire, and Iran’s Tasnim news agency, citing a source familiar with the negotiations, suggested that the framework of the agreement is not yet confirmed.
Beyond that, investors await a slew of key fundamental releases in the US, starting with the US ISM Manufacturing PMI, due later on Monday, and ending on Friday with the all-important May Nonfarm Payrolls report. These figures may help to assess the next moves from a divided US Federal Reserve committee and hence, set the near-term direction for USD crosses.
Technical Analysis: Forming a triangle pattern
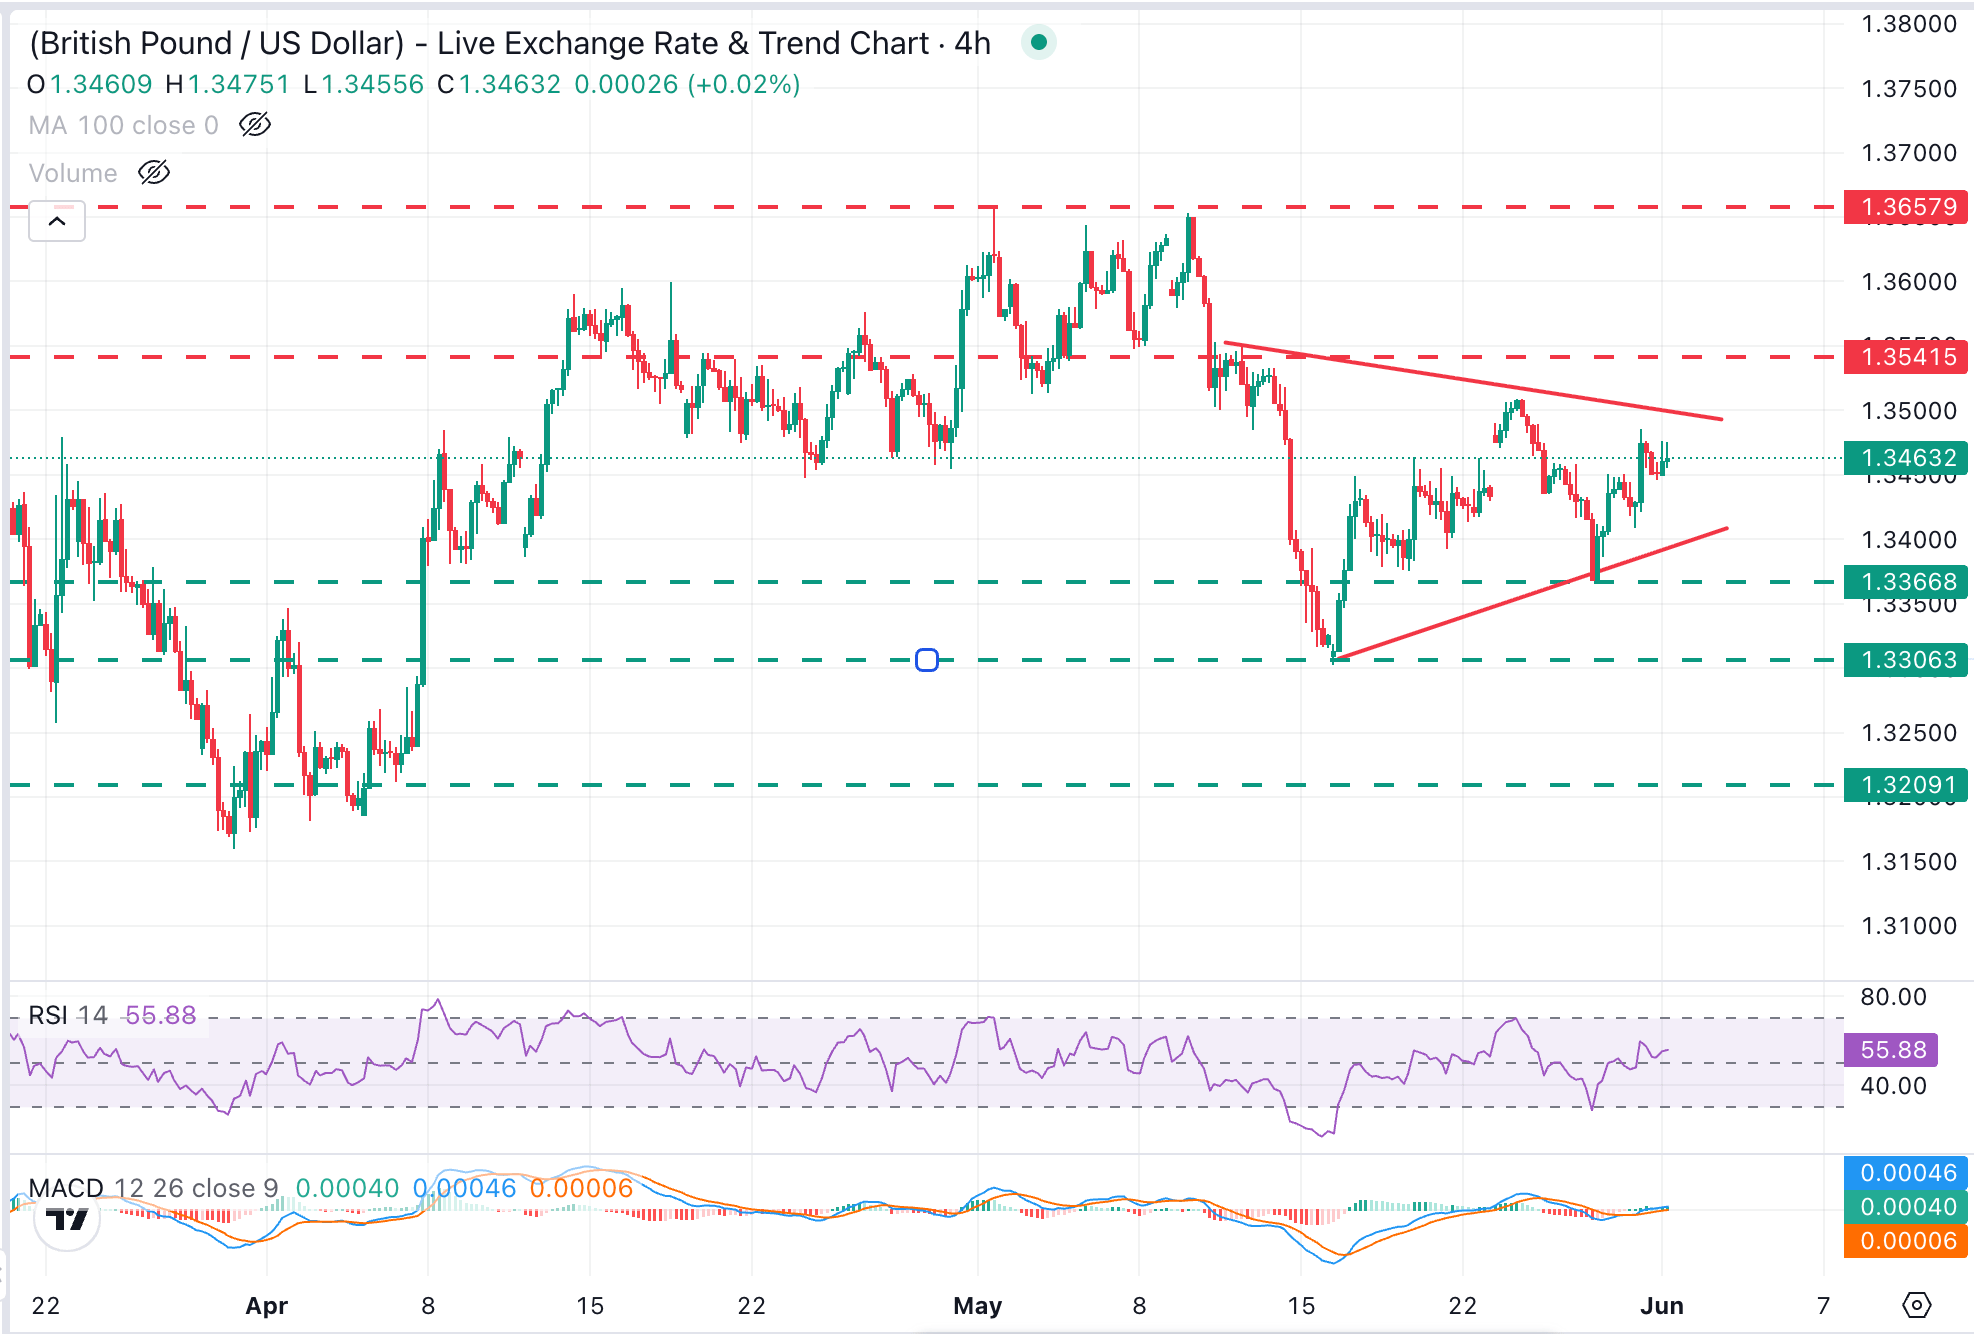
GBP/USD trades at 1.3461, holding a constructive bullish bias with a succession of lower highs and higher lows forming a triangle pattern. Triangles are considered continuation patterns and, in this case, a bearish outcome is favoured.
Momentum indicators in 4-hour charts show a mild bullish pressure. The Relative Strength Index (RSI) lies right above the 50 midline modestly, and the Moving Average Convergence Divergence (MACD) histogram has turned slightly positive.
On the topside, the triangle top lies in the area of 1.3500, which, together with the May 13 high, at the 1.3540 area, is likely to close the path towards May's peak, right above 1.3650. On the downside, the triangle's bottom is around 1.3400. Below here, last week's low, at 1.3365, and the May 15 low in the 1.3300 area will come into focus.
(The technical analysis of this story was written with the help of an AI tool.)
Pound Sterling Price Today
The table below shows the percentage change of British Pound (GBP) against listed major currencies today. British Pound was the strongest against the New Zealand Dollar.
| USD | EUR | GBP | JPY | CAD | AUD | NZD | CHF | |
|---|---|---|---|---|---|---|---|---|
| USD | 0.11% | -0.10% | 0.14% | 0.25% | 0.14% | 0.55% | 0.40% | |
| EUR | -0.11% | -0.19% | 0.00% | 0.14% | 0.08% | 0.46% | 0.27% | |
| GBP | 0.10% | 0.19% | 0.21% | 0.33% | 0.21% | 0.63% | 0.45% | |
| JPY | -0.14% | 0.00% | -0.21% | 0.13% | 0.02% | 0.44% | 0.25% | |
| CAD | -0.25% | -0.14% | -0.33% | -0.13% | -0.11% | 0.30% | 0.12% | |
| AUD | -0.14% | -0.08% | -0.21% | -0.02% | 0.11% | 0.36% | 0.23% | |
| NZD | -0.55% | -0.46% | -0.63% | -0.44% | -0.30% | -0.36% | -0.18% | |
| CHF | -0.40% | -0.27% | -0.45% | -0.25% | -0.12% | -0.23% | 0.18% |
The heat map shows percentage changes of major currencies against each other. The base currency is picked from the left column, while the quote currency is picked from the top row. For example, if you pick the British Pound from the left column and move along the horizontal line to the US Dollar, the percentage change displayed in the box will represent GBP (base)/USD (quote).

超過一百萬用戶依賴 FXStreet 獲取即時市場數據、圖表工具、專家洞見與外匯新聞。其全面的經濟日曆與教育網路研討會協助交易者保持資訊領先、做出審慎決策。FXStreet 擁有約 60 人的團隊,分布於巴塞隆納總部及全球各地。
閱讀更多


