
GBP/USD Price Forecast: Rebounds toward 1.3850 near four-year highs
作者 Akhtar Faruqui
發布日期: 29 Jan 2026 | 修改日期: 29 Jan 2026


熱門文章

GBP/USD recovers its recent losses from the previous session, trading around 1.3830 during the Asian hours on Thursday. The technical analysis of the daily chart points to a potential bearish reversal as the range narrows, indicating waning buyer momentum within a rising wedge pattern.
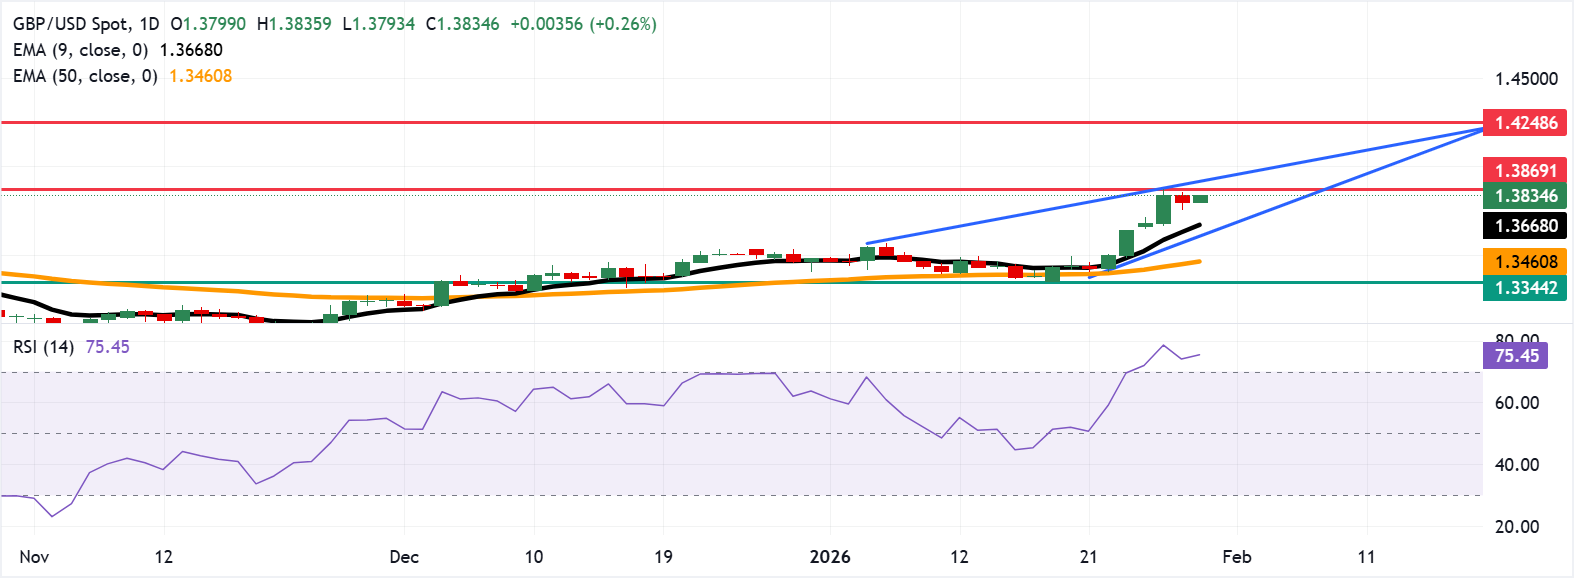
- GBP/USD rises toward 1.3869, the highest since September 2021.
- Price remains above the nine-day and 50-day EMAs, maintaining a short-term bullish bias.
- The 14-day Relative Strength Index near 75 suggests momentum may be stretched, and gains could moderate.
GBP/USD recovers its recent losses from the previous session, trading around 1.3830 during the Asian hours on Thursday. The technical analysis of the daily chart points to a potential bearish reversal as the range narrows, indicating waning buyer momentum within a rising wedge pattern.
The GBP/USD pair extends above the rising nine-day Exponential Moving Average (EMA) and the 50-day EMA, keeping the short-term bullish bias intact. The faster average holds comfortably above the slower line, with both slopes pointing higher. The fast average stays above the slow line, reinforcing the positive structure. Pullbacks could find demand near the nine-day EMA, while the 50-day EMA supports the broader uptrend.
The momentum indicator 14-day Relative Strength Index (RSI) at 75 (overbought) signals stretched momentum that could temper gains. RSI remains above 70, and an unwinding of momentum could precede a healthier extension.
The immediate resistance lies at 1.3869, the highest since September 2021, followed by the upper boundary of the rising wedge around 1.3910. A sustained break could open a fresh leg higher toward 1.4248, the highest since April 2018.
The primary support is seen at the nine-day EMA of 1.3667, followed by the lower rising wedge boundary around 1.3610. A break below the wedge would cause the emergence of a bearish bias and expose the 50-day EMA support at 1.3461.
(The technical analysis of this story was written with the help of an AI tool.)
Pound Sterling Price Today
The table below shows the percentage change of British Pound (GBP) against listed major currencies today. British Pound was the strongest against the US Dollar.
| USD | EUR | GBP | JPY | CAD | AUD | NZD | CHF | |
|---|---|---|---|---|---|---|---|---|
| USD | -0.34% | -0.26% | -0.21% | -0.27% | -0.83% | -0.59% | -0.50% | |
| EUR | 0.34% | 0.08% | 0.09% | 0.07% | -0.49% | -0.27% | -0.16% | |
| GBP | 0.26% | -0.08% | 0.04% | -0.01% | -0.59% | -0.35% | -0.24% | |
| JPY | 0.21% | -0.09% | -0.04% | -0.05% | -0.60% | -0.39% | -0.28% | |
| CAD | 0.27% | -0.07% | 0.01% | 0.05% | -0.56% | -0.33% | -0.24% | |
| AUD | 0.83% | 0.49% | 0.59% | 0.60% | 0.56% | 0.24% | 0.34% | |
| NZD | 0.59% | 0.27% | 0.35% | 0.39% | 0.33% | -0.24% | 0.09% | |
| CHF | 0.50% | 0.16% | 0.24% | 0.28% | 0.24% | -0.34% | -0.09% |
The heat map shows percentage changes of major currencies against each other. The base currency is picked from the left column, while the quote currency is picked from the top row. For example, if you pick the British Pound from the left column and move along the horizontal line to the US Dollar, the percentage change displayed in the box will represent GBP (base)/USD (quote).

超過一百萬用戶依賴 FXStreet 獲取即時市場數據、圖表工具、專家洞見與外匯新聞。其全面的經濟日曆與教育網路研討會協助交易者保持資訊領先、做出審慎決策。FXStreet 擁有約 60 人的團隊,分布於巴塞隆納總部及全球各地。
閱讀更多


