
GBP/USD sinks nearly 100 pips as UK jobless rate hits decade high
作者 Christian Borjon Valencia
發布日期: 17 Feb 2026 | 修改日期: 17 Feb 2026


熱門文章

The Pound Sterling (GBP) dives during the North American session on Tuesday as traders got back to their desks following the US Presidents' Day holiday. A weaker-than-expected UK jobs report weighed on GBP/USD, which is down 0.71% or nearly 100 pips at 1.3529.
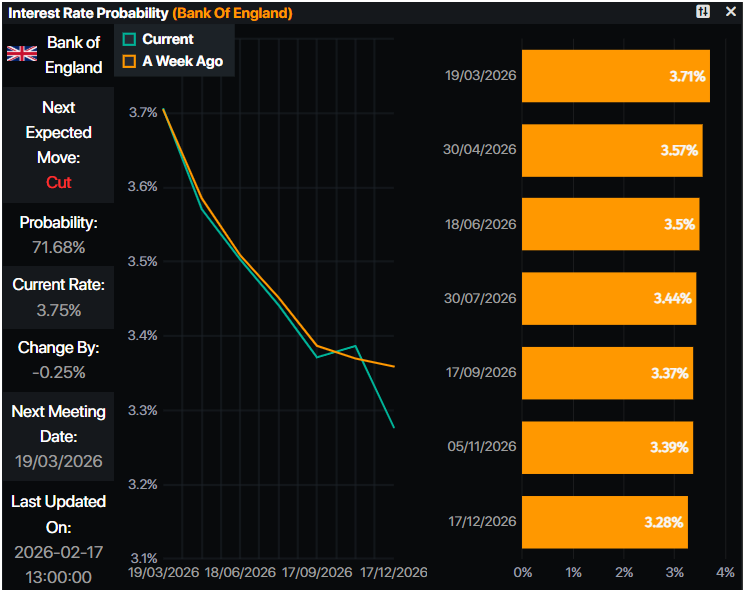
- GBP/USD drops 0.71% as UK unemployment climbs to 5.2%, highest in a decade, excluding the pandemic.
- Cooling wage growth boosts expectations of a March cut by the Bank of England.
- Rate differential favors the Dollar's strength as markets price nearly 50 bps of UK easing this year.
The Pound Sterling (GBP) dives during the North American session on Tuesday as traders got back to their desks following the US Presidents' Day holiday. A weaker-than-expected UK jobs report weighed on GBP/USD, which is down 0.71% or nearly 100 pips at 1.3529.
Sterling tumbles after weak UK labor data fuels bets on a March rate cut by the Bank of England
The Office for National Statistics (ONS) revealed that the ILO Unemployment Rate in the three months to December rose to its highest level in a decade, excluding the pandemic, hitting 5.2% up from 5.1% in November and estimates. Also, Average Earnings Excluding Bonus for the same period dipped from 4.4% to 4.2%, showing signs of cooling, which fueled speculation that the Bank of England (BoE) would cut rates at the March 19 meeting.
Data from Prime Market Terminal shows odds for a BoE 25 bps rate cut at 71%. Meanwhile, for the full year, money markets had priced in 49 bps of easing.
Ahead of the week, traders are eyeing the release of inflation data on Wednesday for the UK, with the CPI expected to dip from 3.4% to 3% in January.
Data in the US remains scarce, yet the New York Empire State Manufacturing Index in January increased to 7.1, exceeding estimates of 7 but below December’s 7.7 print.
Richard Deitz, Economic Research Advisor at the New York Fed, wrote, “After a small dip in December, manufacturing activity increased modestly in New York State in January. Selling prices rose at the slowest pace in nearly a year. Firms remained fairly optimistic that conditions would improve.”
Regarding labor market data, the ADP Employment Change 4-week average rose from 7.8K to 10.3K.
Fed officials remain hawkish
Chicago Fed President Austan Goolsbee said that inflation was pulled down by base effects and that further easing lies ahead if inflation heads down. He sees the neutral rate at 3% and seeks evidence that prices are headed back to 2%.
Given the fundamental backdrop updated on Tuesday and the interest rates differential to favor the US if the BoE cuts rates in March, it favors further GBP/USD downside.
Ahead in the US, traders are eyeing housing data, speeches by Fed policymakers, GDP figures and the release of the Fed’s preferred inflation gauge, the core PCE.
GBP/USD Price Forecast: Technical outlook
In the daily chart, GBP/USD trades at 1.3502. The simple moving averages slope higher, reinforcing a medium-term bullish bias. Price sits just beneath the nearest average at 1.3522, which caps immediate rebounds. A daily close above that barrier would improve upside traction and revive the advance.
The rising trend line from 1.3035 underpins the broader structure, with support aligning near 1.3511. A clear break below the line would signal a loss of momentum and could shift the tone toward consolidation, while holding above it keeps the path of least resistance pointed higher.
(The technical analysis of this story was written with the help of an AI tool.)
Pound Sterling Price This week
The table below shows the percentage change of British Pound (GBP) against listed major currencies this week. British Pound was the strongest against the Swiss Franc.
| USD | EUR | GBP | JPY | CAD | AUD | NZD | CHF | |
|---|---|---|---|---|---|---|---|---|
| USD | 0.56% | 1.10% | 0.77% | 0.59% | 0.57% | 0.39% | 0.67% | |
| EUR | -0.56% | 0.52% | 0.24% | 0.03% | -0.01% | -0.17% | 0.11% | |
| GBP | -1.10% | -0.52% | -0.56% | -0.50% | -0.53% | -0.70% | -0.42% | |
| JPY | -0.77% | -0.24% | 0.56% | -0.20% | -0.21% | -0.40% | -0.07% | |
| CAD | -0.59% | -0.03% | 0.50% | 0.20% | -0.07% | -0.21% | 0.08% | |
| AUD | -0.57% | 0.00% | 0.53% | 0.21% | 0.07% | -0.17% | 0.11% | |
| NZD | -0.39% | 0.17% | 0.70% | 0.40% | 0.21% | 0.17% | 0.29% | |
| CHF | -0.67% | -0.11% | 0.42% | 0.07% | -0.08% | -0.11% | -0.29% |
The heat map shows percentage changes of major currencies against each other. The base currency is picked from the left column, while the quote currency is picked from the top row. For example, if you pick the British Pound from the left column and move along the horizontal line to the US Dollar, the percentage change displayed in the box will represent GBP (base)/USD (quote).

超過一百萬用戶依賴 FXStreet 獲取即時市場數據、圖表工具、專家洞見與外匯新聞。其全面的經濟日曆與教育網路研討會協助交易者保持資訊領先、做出審慎決策。FXStreet 擁有約 60 人的團隊,分布於巴塞隆納總部及全球各地。
閱讀更多


