
Hyperliquid Price Forecast: Takes a breather after new all-time highs
作者 Manish Chhetri
更新: 23 Jun 2026


熱門文章

Hyperliquid (HYPE) remains under pressure and is stabilizing around $66 on Tuesday after retreating from its record high of $76.9 reached last week.
- Hyperliquid stabilizes near $66 on Tuesday after hitting a record high of $76.9 last week before pulling back.
- Positive funding rates and increasing bullish bets indicate traders continue to favor further upside.
- Traders should be cautious as declining social dominance, increasing retail participation, and overheating conditions could cap further rally.
Hyperliquid (HYPE) remains under pressure and is stabilizing around $66 on Tuesday after retreating from its record high of $76.9 reached last week. Derivatives data continues to support a bullish outlook; however, fading social dominance, rising retail participation, and overheating conditions keep traders cautious, suggesting the uptrend could pause before attempting another move higher.
Derivatives traders support further upside
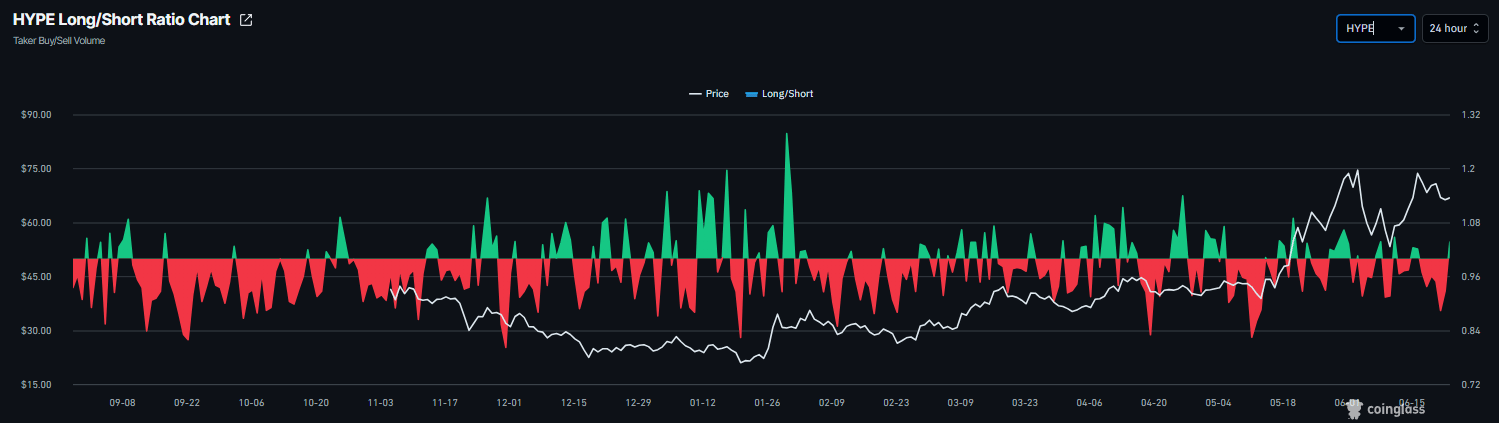
Derivatives metrics support a positive outlook for HYPE. CoinGlass’ long-to-short ratio for HYPE read 1.03 on Tuesday. The ratio being above one indicates bullish sentiment, as traders are betting the assets’ prices will rise.
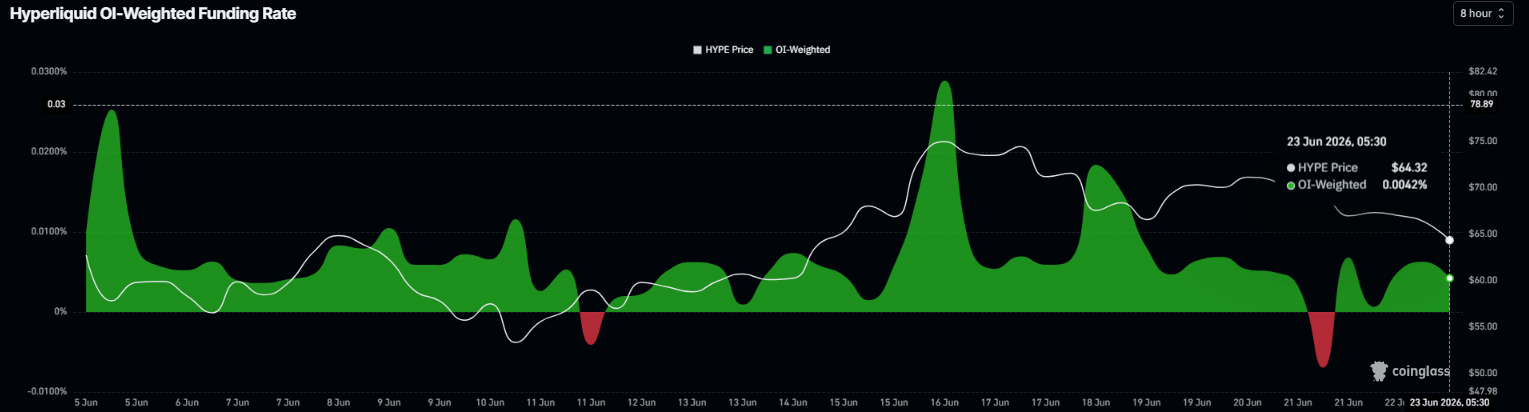
In addition, the funding rates turned positive on Sunday, reading 0.0042% on Tuesday, indicating that longs are paying the shorts and projecting bullish sentiment.
Signs of concern
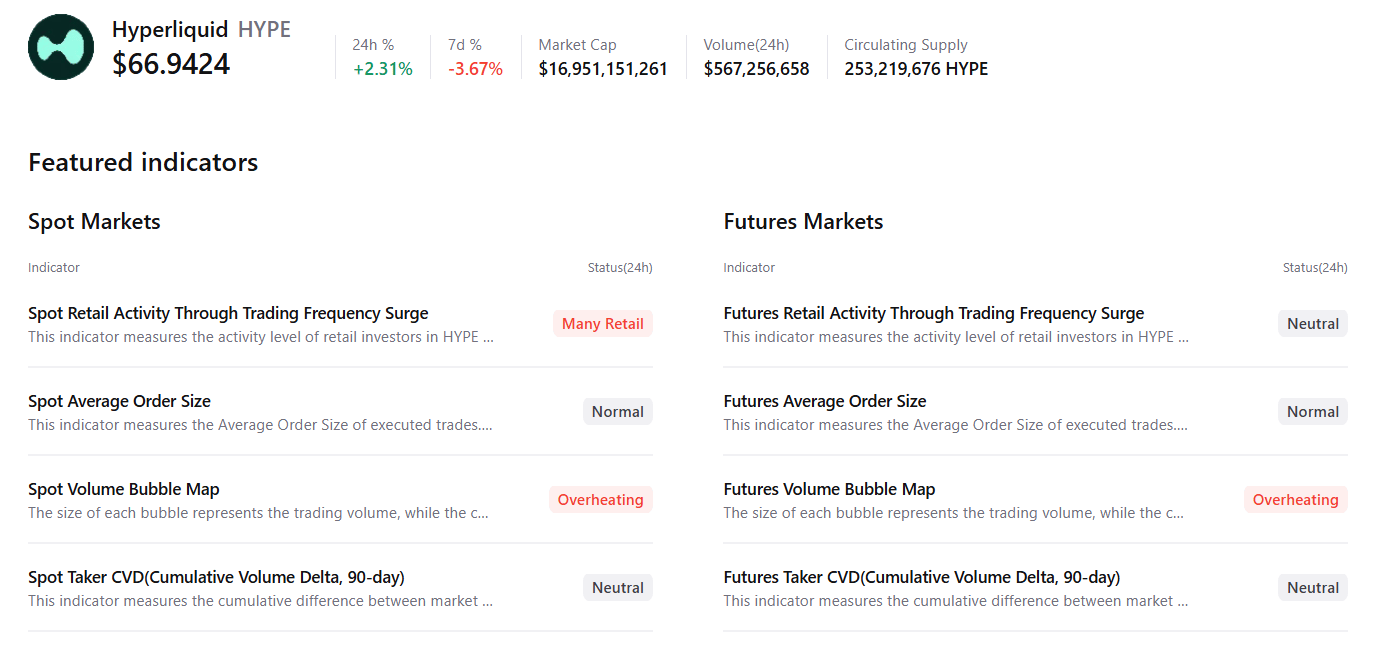
CryptoQuant’s summary data on HYPE’s spot markets show rising retail participation following new record highs last week. In addition, both spot and futures markets show signs of overheating, hinting at bearish sentiment among traders and capping potential upside.
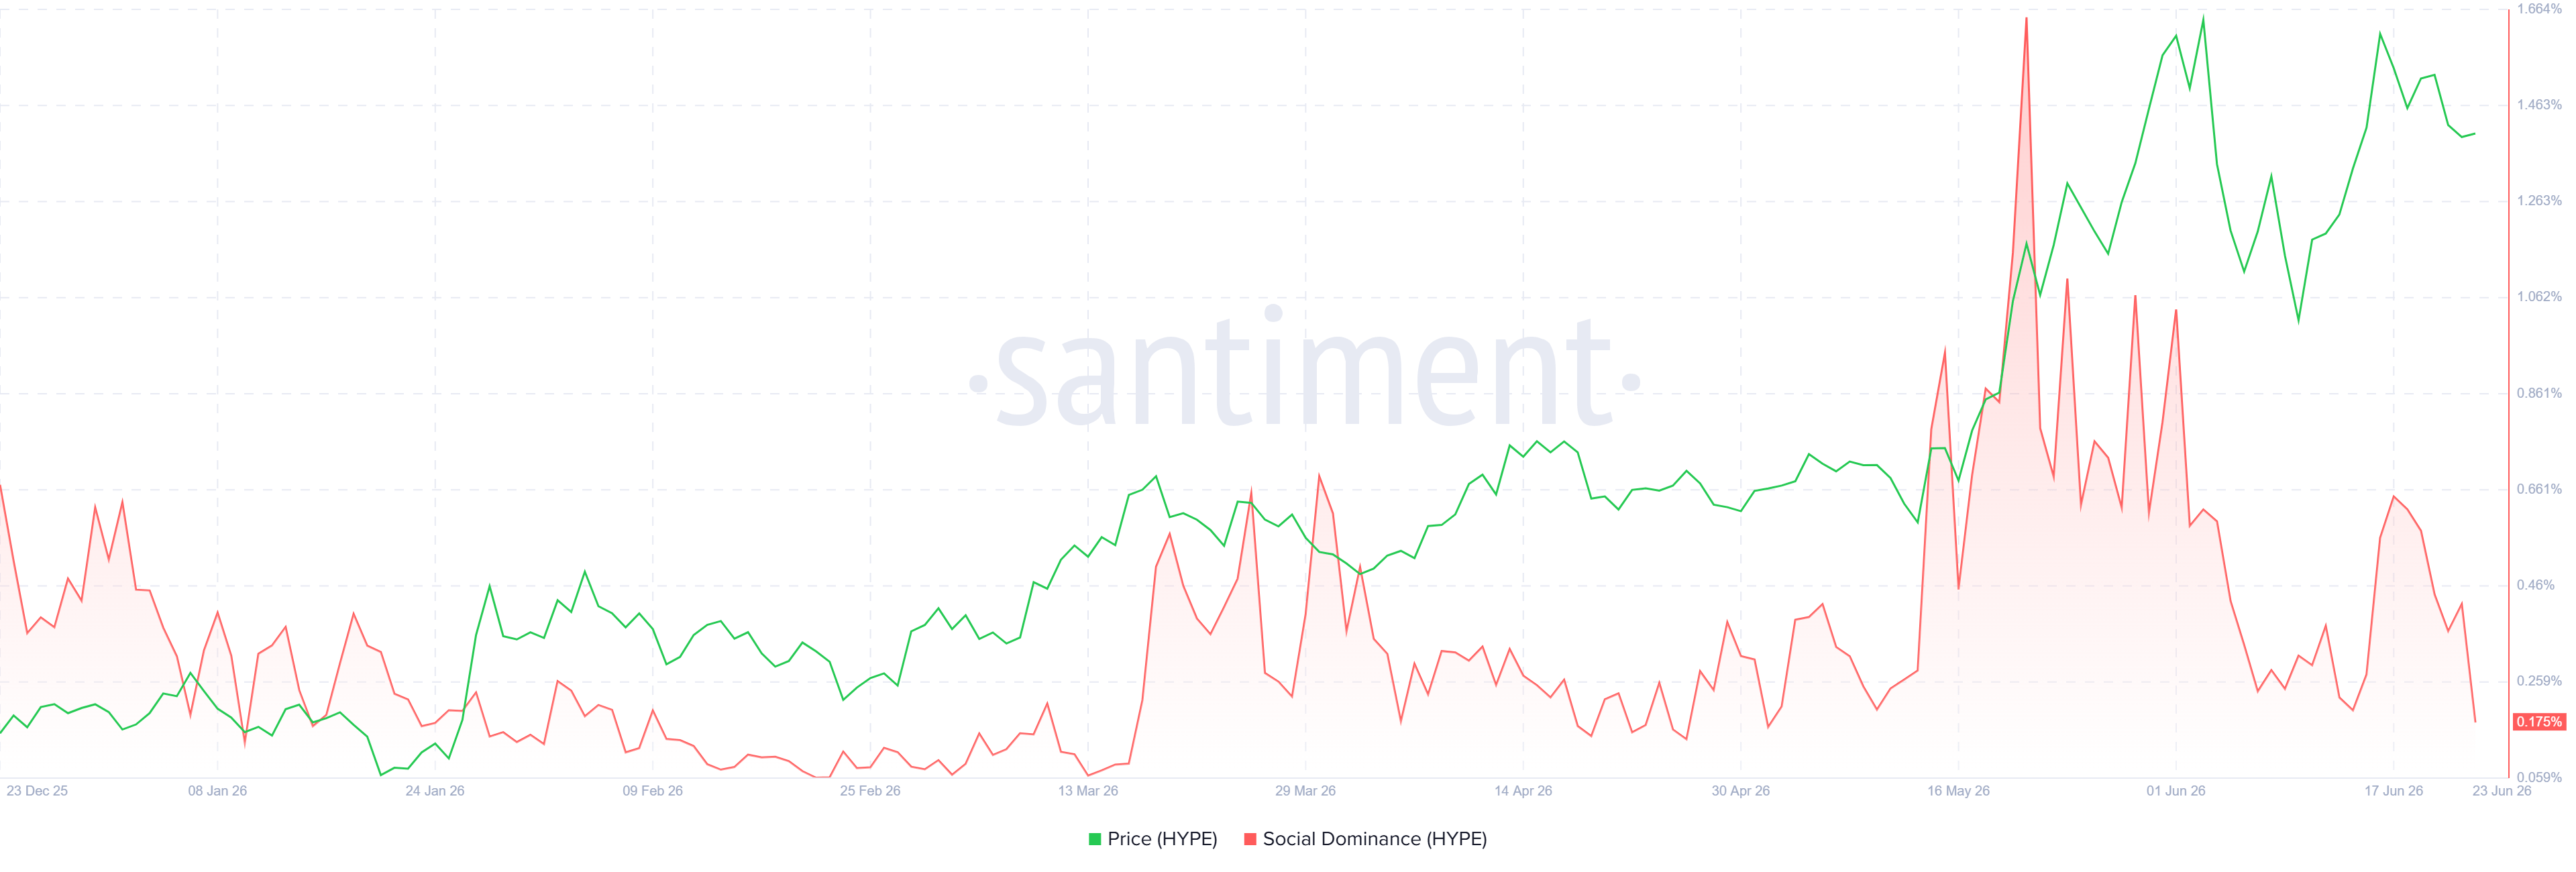
Santiment’s Social Dominance metric for HYPE also supports a bearish outlook. The index measures the share of HYPE-related discussions across the cryptocurrency media. It has been in a downtrend since June 17, with a reading of 0.175% on Tuesday. This fall indicates fading market interest and sentiment among HYPE investors.
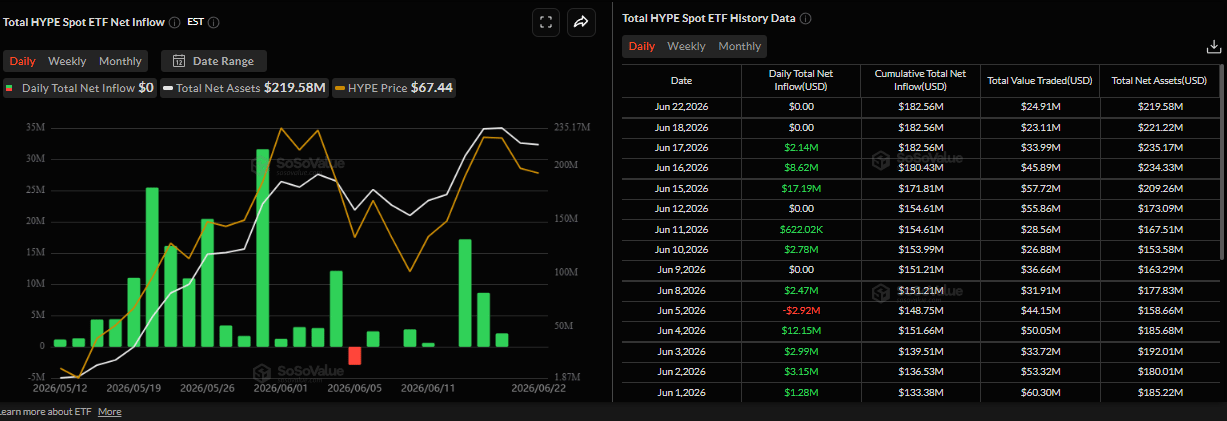
In addition, SoSoValue data shows that spot Exchange Traded Funds (ETFs) have stayed mostly silent so far this week, indicating fading institutional demand. If the flows turn negative this week, HYPE could see a price correction.
Hyperliquid Price Forecast: Where is HYPE heading?
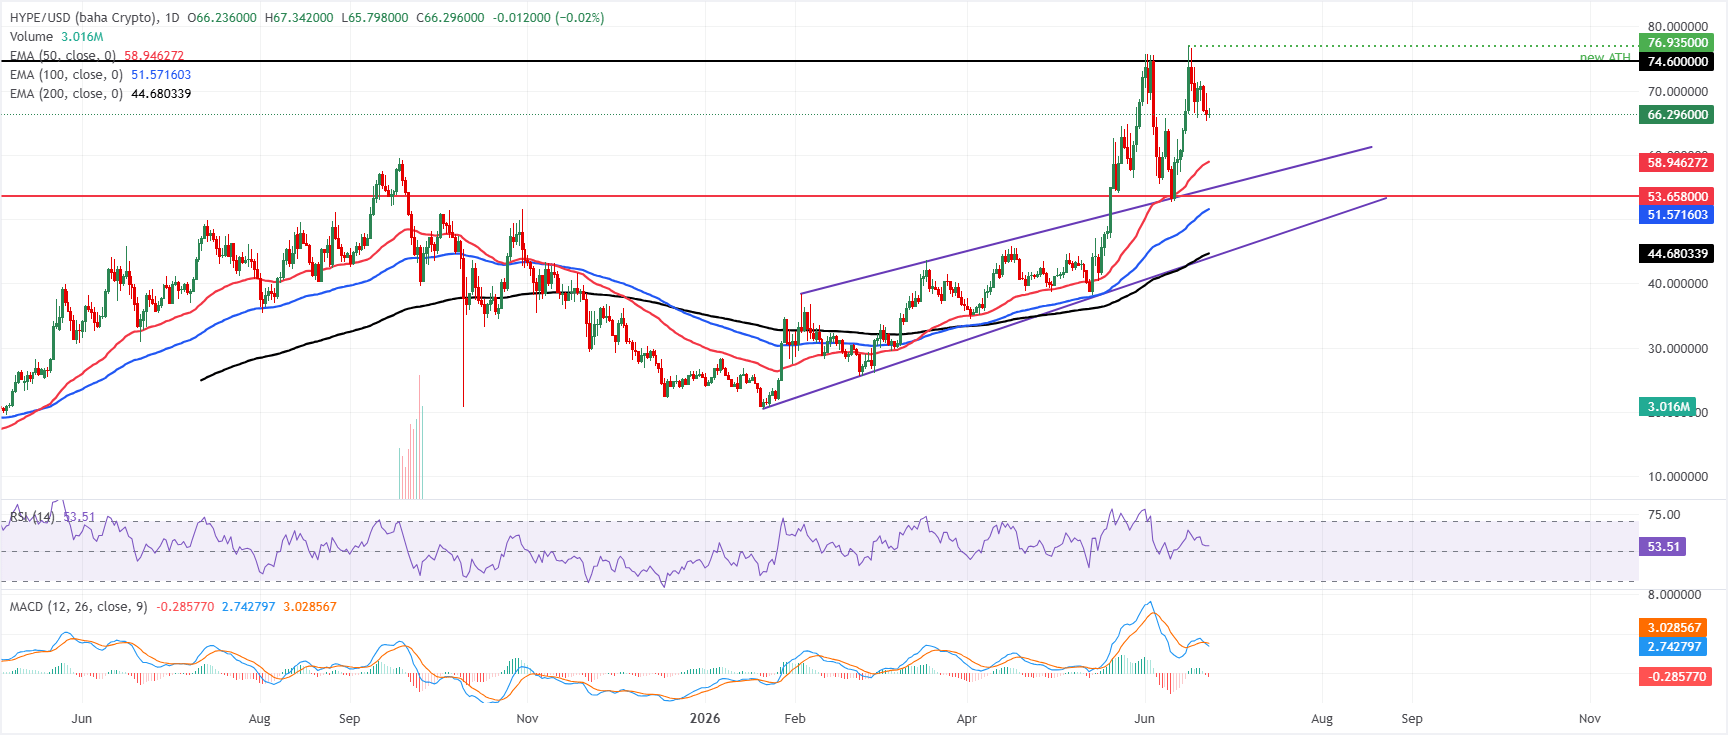
Hyperliquid trades at $66 on Tuesday, maintaining a constructive bullish bias as it consolidates well above its key Exponential Moving Averages (EMAs). The 50-day EMA at $58.94, the 100-day EMA at $51.57, and the 200-day EMA at $44.68 all trail price and suggest an underlying uptrend, reinforced by an intact rising support line whose last key reaction level sits near $43.97.
Momentum is more neutral than exuberant, with the Relative Strength Index (RSI) hovering around 53 on the daily chart and the Moving Average Convergence Divergence (MACD) indicator slightly negative, hinting that upside pressure has cooled without yet undermining the broader positive backdrop.
On the downside, initial support is seen at the 50-day EMA near $58.94, with stronger underlying demand emerging at the horizontal shelf around $53.66 and deeper down at the 100-day EMA at $51.57. A more pronounced corrective phase would likely look to the 200-day EMA at $44.68 and the prior trendline reaction area near $43.97 as a major bullish line in the sand.
On the topside, the next notable resistance is the horizontal barrier around $74.60; a daily close above this level would reopen the path toward fresh highs, while repeated failures beneath it would keep HYPE in a consolidative phase within the prevailing uptrend.
(The technical analysis of this story was written with the help of an AI tool.)

超過一百萬用戶依賴 FXStreet 獲取即時市場數據、圖表工具、專家洞見與外匯新聞。其全面的經濟日曆與教育網路研討會協助交易者保持資訊領先、做出審慎決策。FXStreet 擁有約 60 人的團隊,分布於巴塞隆納總部及全球各地。
閱讀更多


