
Litecoin Price Forecast: LTC sellers tighten grip, eyeing a move below $40
作者 Manish Chhetri
更新: 10 Jun 2026


熱門文章

Litecoin (LTC) remains under pressure, trading below $43 on Wednesday after suffering a steep correction last week. Bearish sentiment continues to build as derivatives metrics signal reduced bullish conviction.
- Litecoin trades below $43 on Wednesday after a massive correction in the previous week.
- Derivatives metrics back a bearish outlook with declining open interest and rising short bets.
- The technical outlook suggests sellers are in control, aiming for levels below $40.
Litecoin (LTC) remains under pressure, trading below $43 on Wednesday after suffering a steep correction last week. Bearish sentiment continues to build as derivatives metrics signal reduced bullish conviction. In addition, a weakening technical outlook suggests LTC could face further downside below the $40 mark.
Derivatives metrics show bearish bias
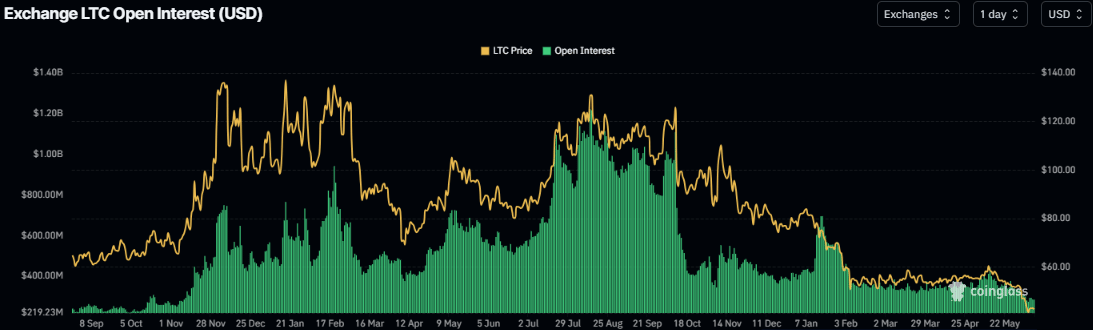
Litecoin’s derivatives data shows a bearish bias. CoinGlass’ Open Interest (OI) for LTC drops to $283 million on Wednesday from the May high of $411 million, reaching levels not seen since November 2024. This steady drop in OI reflects waning investor participation and projects a bearish outlook.
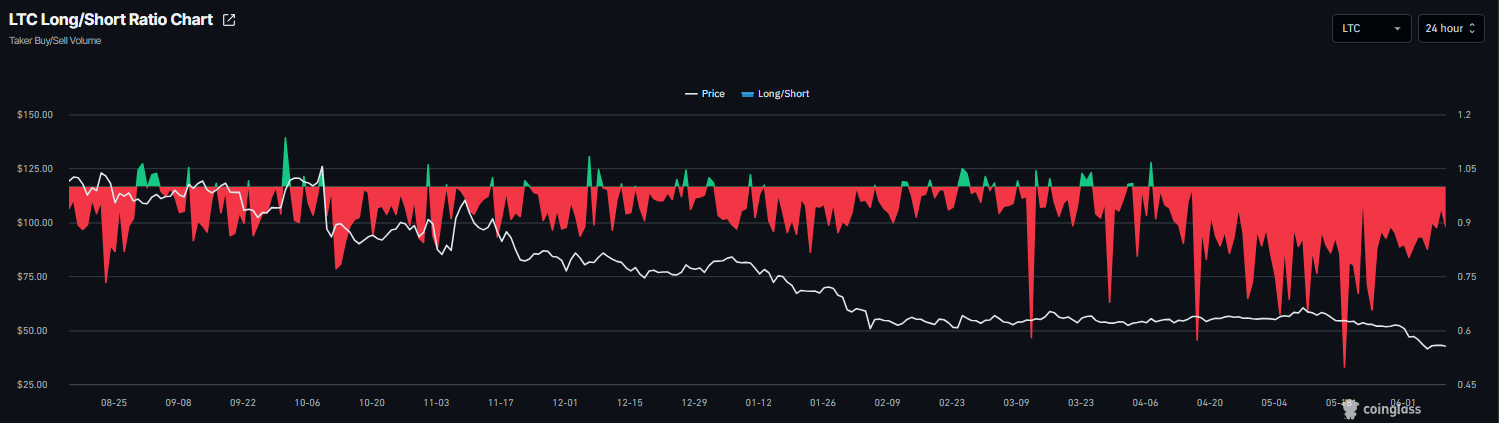
In addition, Coinglass’s long-to-short ratio for Litecoin reads 0.88 on Wednesday, nearing the lowest level over a month. The ratio being below one, indicates bearish sentiment, as traders are betting the asset’s price will fall.
Litecoin Price Forecast: Bears aiming for lower lows
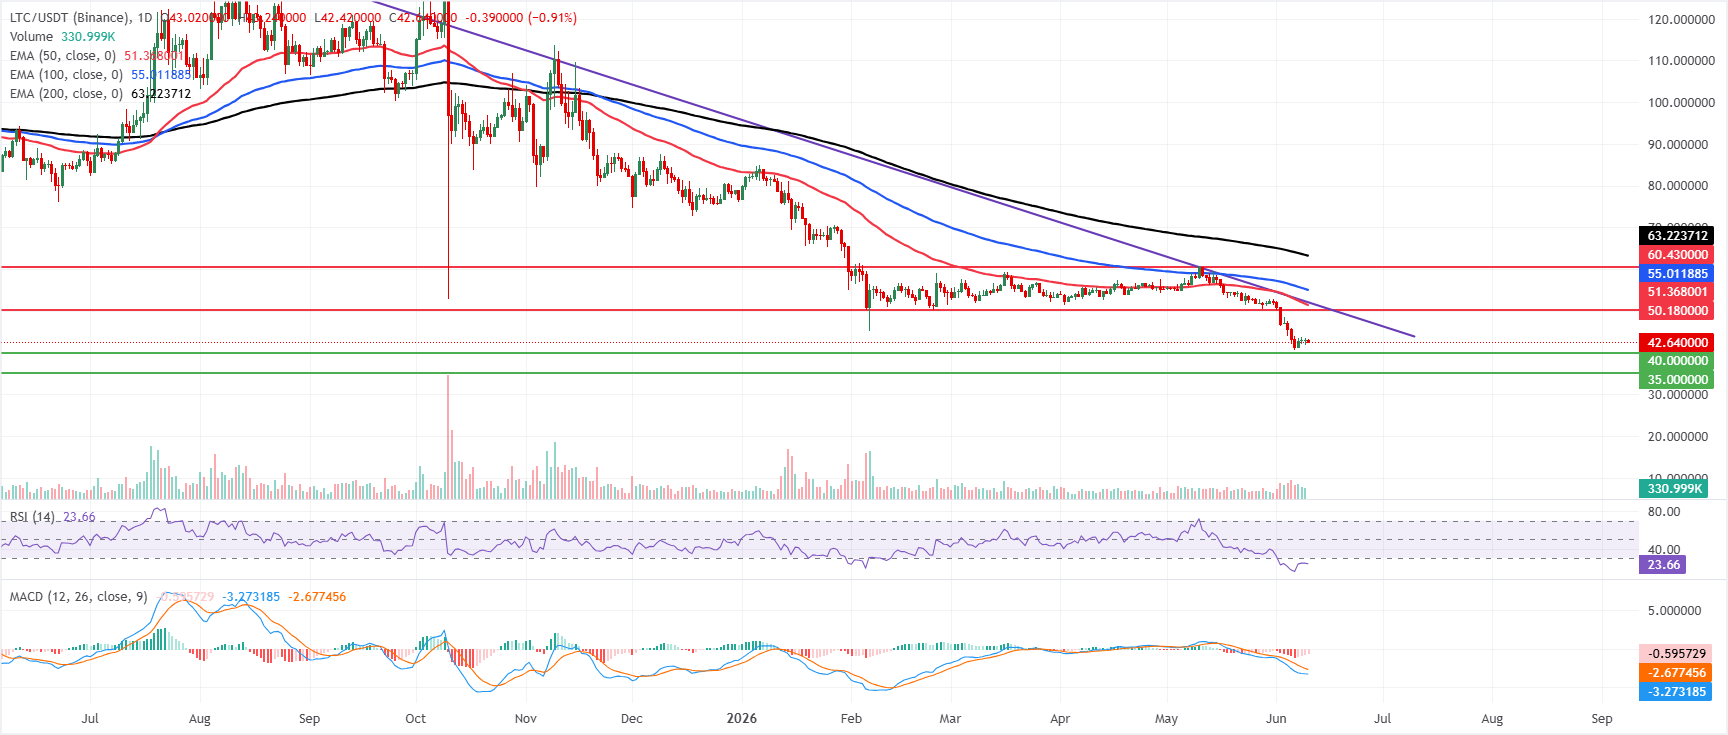
Litecoin price trades at $42.54 on Wednesday, retaining a bearish near-term bias as it holds well below the 50-day, 100-day, and 200-day Exponential Moving Averages (EMAs) at $51.36, $55.01, and $63.22, respectively. The long-standing descending trendline, now projecting resistance around the prior break near $51.99, reinforces the idea that rallies are capped. At the same time, the Relative Strength Index (RSI) on the daily chart at 23 sits in oversold territory. The Moving Average Convergence Divergence (MACD) remains negative, hinting that downside pressure persists despite stretched conditions.
On the topside, initial resistance is at the horizontal barrier of $50.18, followed closely by the 50-day EMA at $51.36 and the nearby trendline resistance at $51.99. The 100-day EMA at $55.01 and the $60.43 and $63.22 levels form successive caps should a stronger rebound unfold.
On the downside, immediate support emerges at the $40.00 horizontal level, ahead of a deeper floor near $35.00, where buyers would be expected to show more interest if the current decline extends.
(The technical analysis of this story was written with the help of an AI tool.)

超過一百萬用戶依賴 FXStreet 獲取即時市場數據、圖表工具、專家洞見與外匯新聞。其全面的經濟日曆與教育網路研討會協助交易者保持資訊領先、做出審慎決策。FXStreet 擁有約 60 人的團隊,分布於巴塞隆納總部及全球各地。
閱讀更多


