
Meme Coins Price Prediction: DOGE leads, SHIB and PEPE gear up for bullish breakouts
作者 Manish Chhetri
更新: 4 May 2026


熱門文章

Meme coins are regaining bullish strength at the start of the week, with Dogecoin (DOGE) taking the lead on Monday after surging over 9% in the previous week.
- Dogecoin extends gains on Monday after surging by more than 9% the previous week.
- Shiba Inu is near the upper boundary of its consolidation at $0.0000063, a breakout suggests a rally ahead.
- Pepe is trading above 100-day EMA, a firm daily close would confirm bullish strength and hint at a fresh rally.
Meme coins are regaining bullish strength at the start of the week, with Dogecoin (DOGE) taking the lead on Monday after surging over 9% in the previous week. Shiba Inu (SHIB) and Pepe (PEPE) are following DOGE’s footsteps, trading in green on Monday and nearing their key resistance zones, where a breakout suggests a fresh rally ahead.
Dogecoin extends gains after closing above key resistance
Dogecoin’s price is extending its gains, trading above $0.113 on Monday after surpassing the key 100-day Exponential Moving Average (EMA) at $0.104 the previous week.
If DOGE continues its upward momentum, it could extend the gains toward the weekly resistance at $0.119.
The Relative Strength Index (RSI) on the daily chart is 78, above the overbought threshold and pointing upward, indicating strong bullish momentum. Moreover, the Moving Average Convergence Divergence (MACD) indicator on the same chart shows rising green histogram bars, supporting the positive outlook.
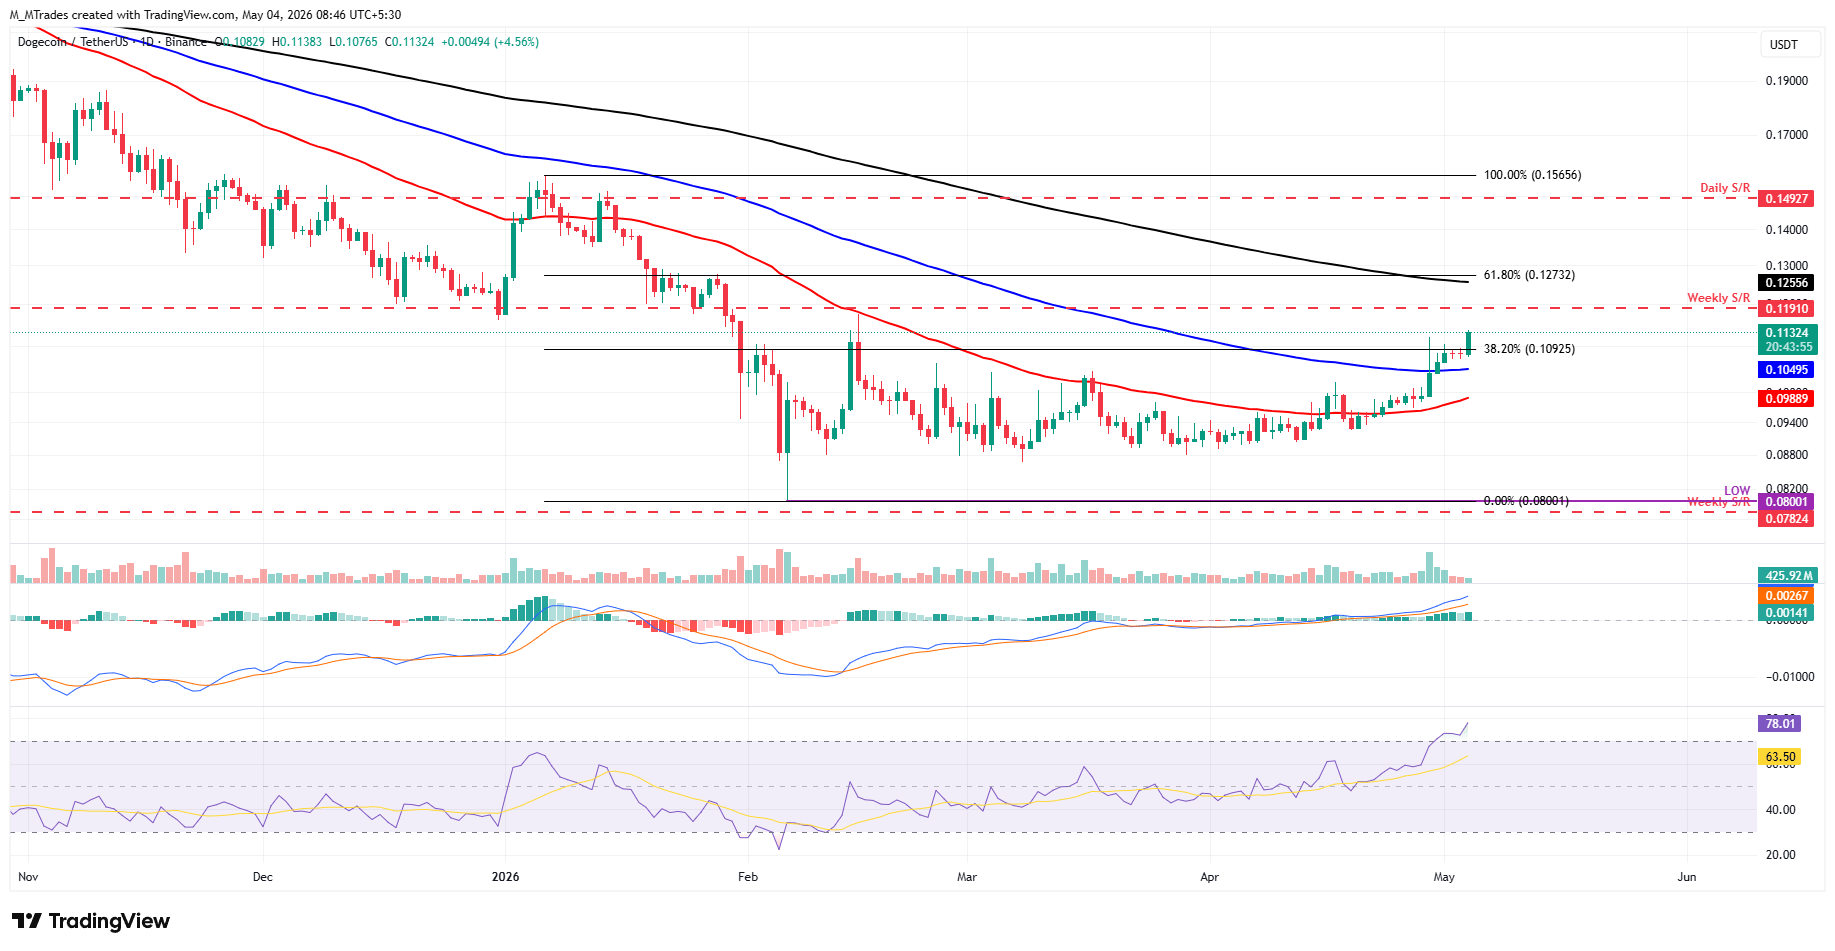
However, if DOGE faces a correction, it could extend the decline toward the 100-day EMA at $0.104.
Shiba Inu consolidation could come to an end
Shiba Inu price found support around the 50-day EMA at $0.0000061 on Sunday and is extending gains, approaching the upper consolidation boundary at $0.0000064 as of Monday.
If SHIB closes above this upper boundary on a daily basis, it could extend the rally toward the 100-day EMA at $0.0000064. A firm close above this level could extend gains toward the weekly resistance at $0.0000068.
The RSI on the daily chart reads 58, above the neutral level of 50 and below the overbought threshold, indicating bullish momentum. Moreover, the MACD indicator on the same chart shows green histogram bars, supporting the positive outlook.
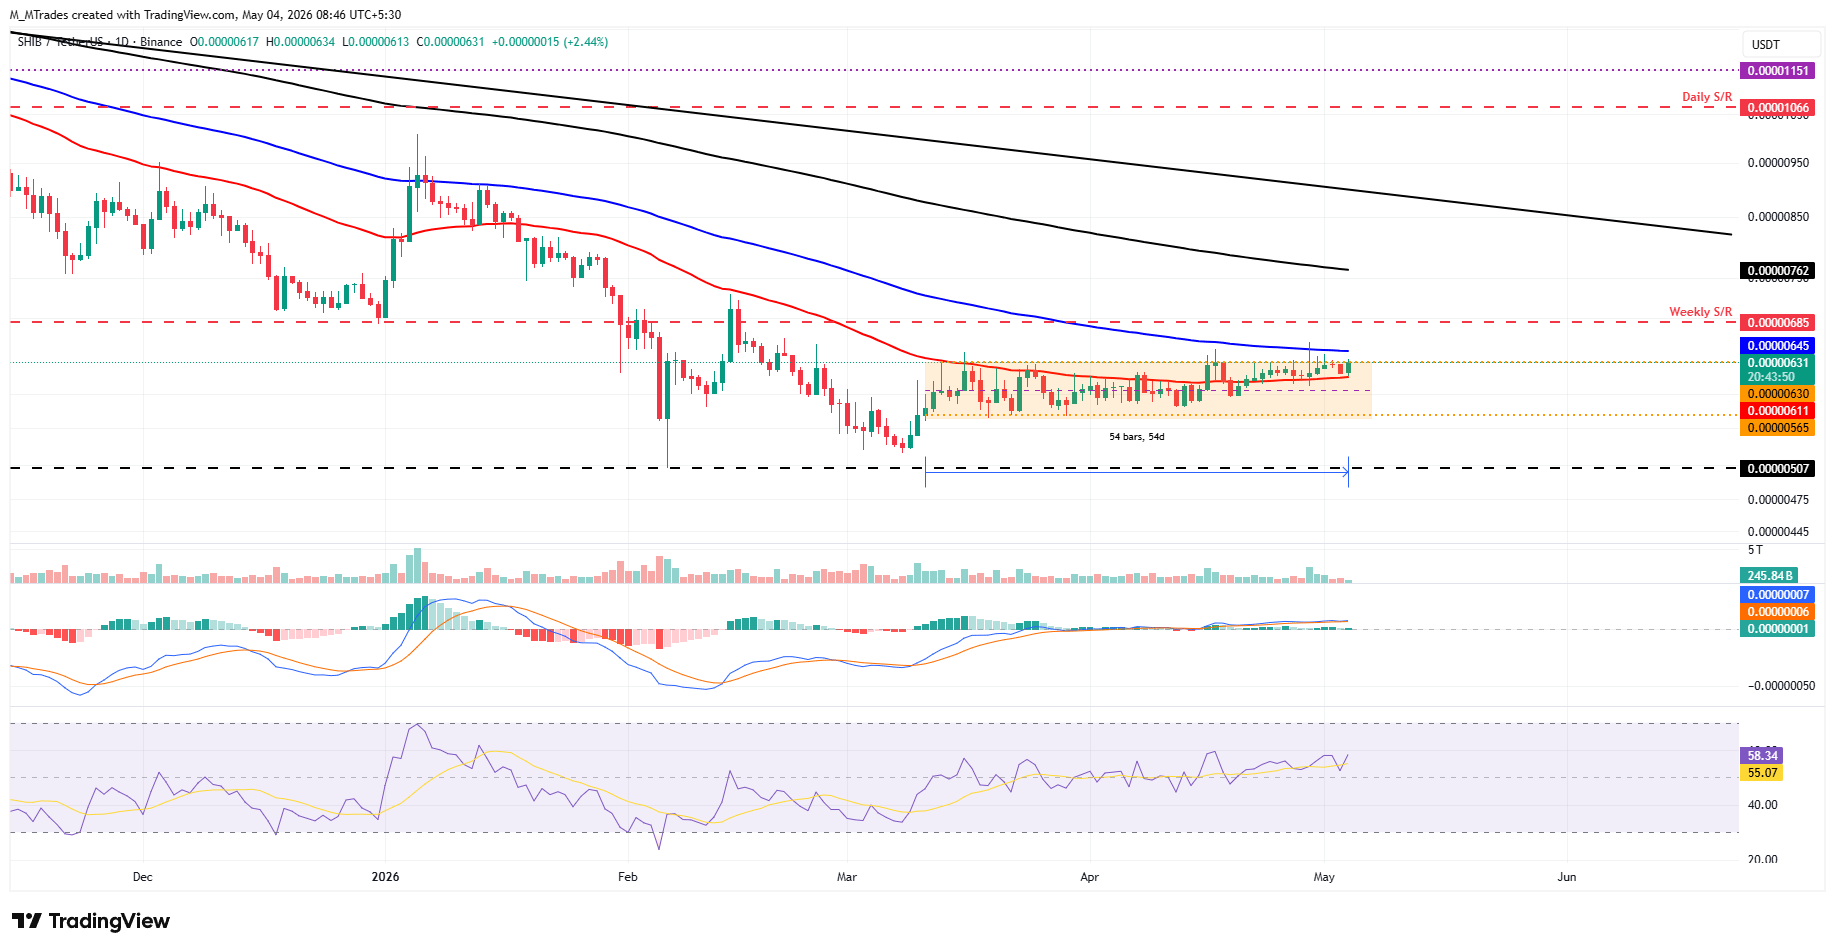
If SHIB faces rejection and corrects, it could extend the decline toward the 50-day EMA at $0.0000061.
Pepe nears key resistance zone
Pepe price is trading just above the 100-day EMA at $0.0000040 on Monday, after finding support at the daily support level of $0.0000039.
If PEPE closes above the 100-day EMA at $0.0000040 on a daily basis, it could extend the rally toward the 200-day EMA at $0.0000050, which roughly coincides with the daily resistance.
The RSI on the daily chart is 62, above the neutral 50 level, indicating bullish strength. Moreover, the MACD also shows a bullish crossover with green histogram bars, supporting the positive outlook.
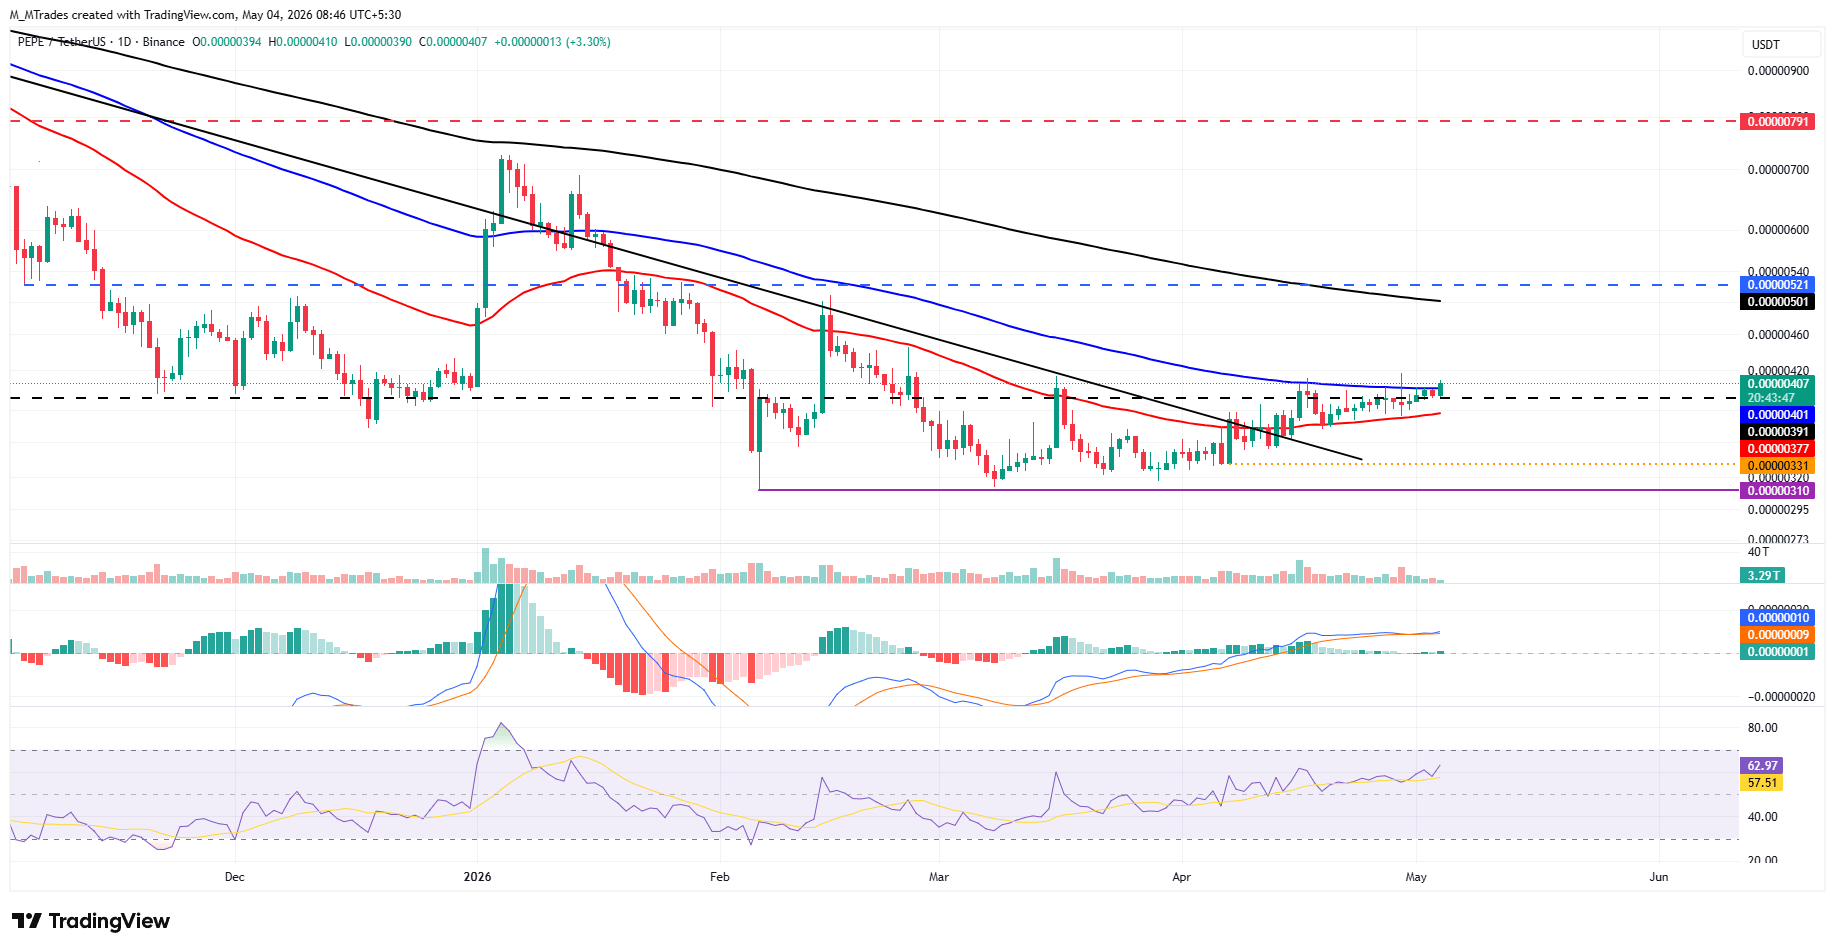
On the other hand, if PEPE pulls back and closes below the 50-day EMA at $0.0000037, it could extend the decline toward the April 7 low at $0.0000033.

超過一百萬用戶依賴 FXStreet 獲取即時市場數據、圖表工具、專家洞見與外匯新聞。其全面的經濟日曆與教育網路研討會協助交易者保持資訊領先、做出審慎決策。FXStreet 擁有約 60 人的團隊,分布於巴塞隆納總部及全球各地。
閱讀更多


