
Ondo Price Forecast: ONDO rally stretches thin as retail confidence grows cautious
作者 Vishal Dixit
更新: 11 May 2026


熱門文章

Ondo (ONDO) extends gains by 4% on Monday, having gained more than 8% earlier in the Asian session after last week’s roughly 50% rally.
- Ondo is up over 4% on Monday, extending its rebound from the 200-day EMA.
- Derivatives data flash early signs of reversal as funding rates flip negative.
- The technical outlook is bullish as ONDO tests the $0.4524 resistance level breakout.
Ondo (ONDO) extends gains by 4% on Monday, having gained more than 8% earlier in the Asian session after last week’s roughly 50% rally. Ondo extends its rally underpinned by the announcement of the first-ever tokenized Treasury bill settlement, but retail confidence shows early signs of weakness as funding rates turn negative. The technical outlook is largely bullish, signaling chances of a breakout rally exceeding $0.50.
Ondo’s retail strength under pressure as rally stretches
Ondo rallied roughly 50% last week, driven by the first-ever tokenized settlement of a short-term US Treasury bill in partnership with J.P. Morgan, Mastercard, and Ripple. However, the price surge is starting to shake retail confidence.
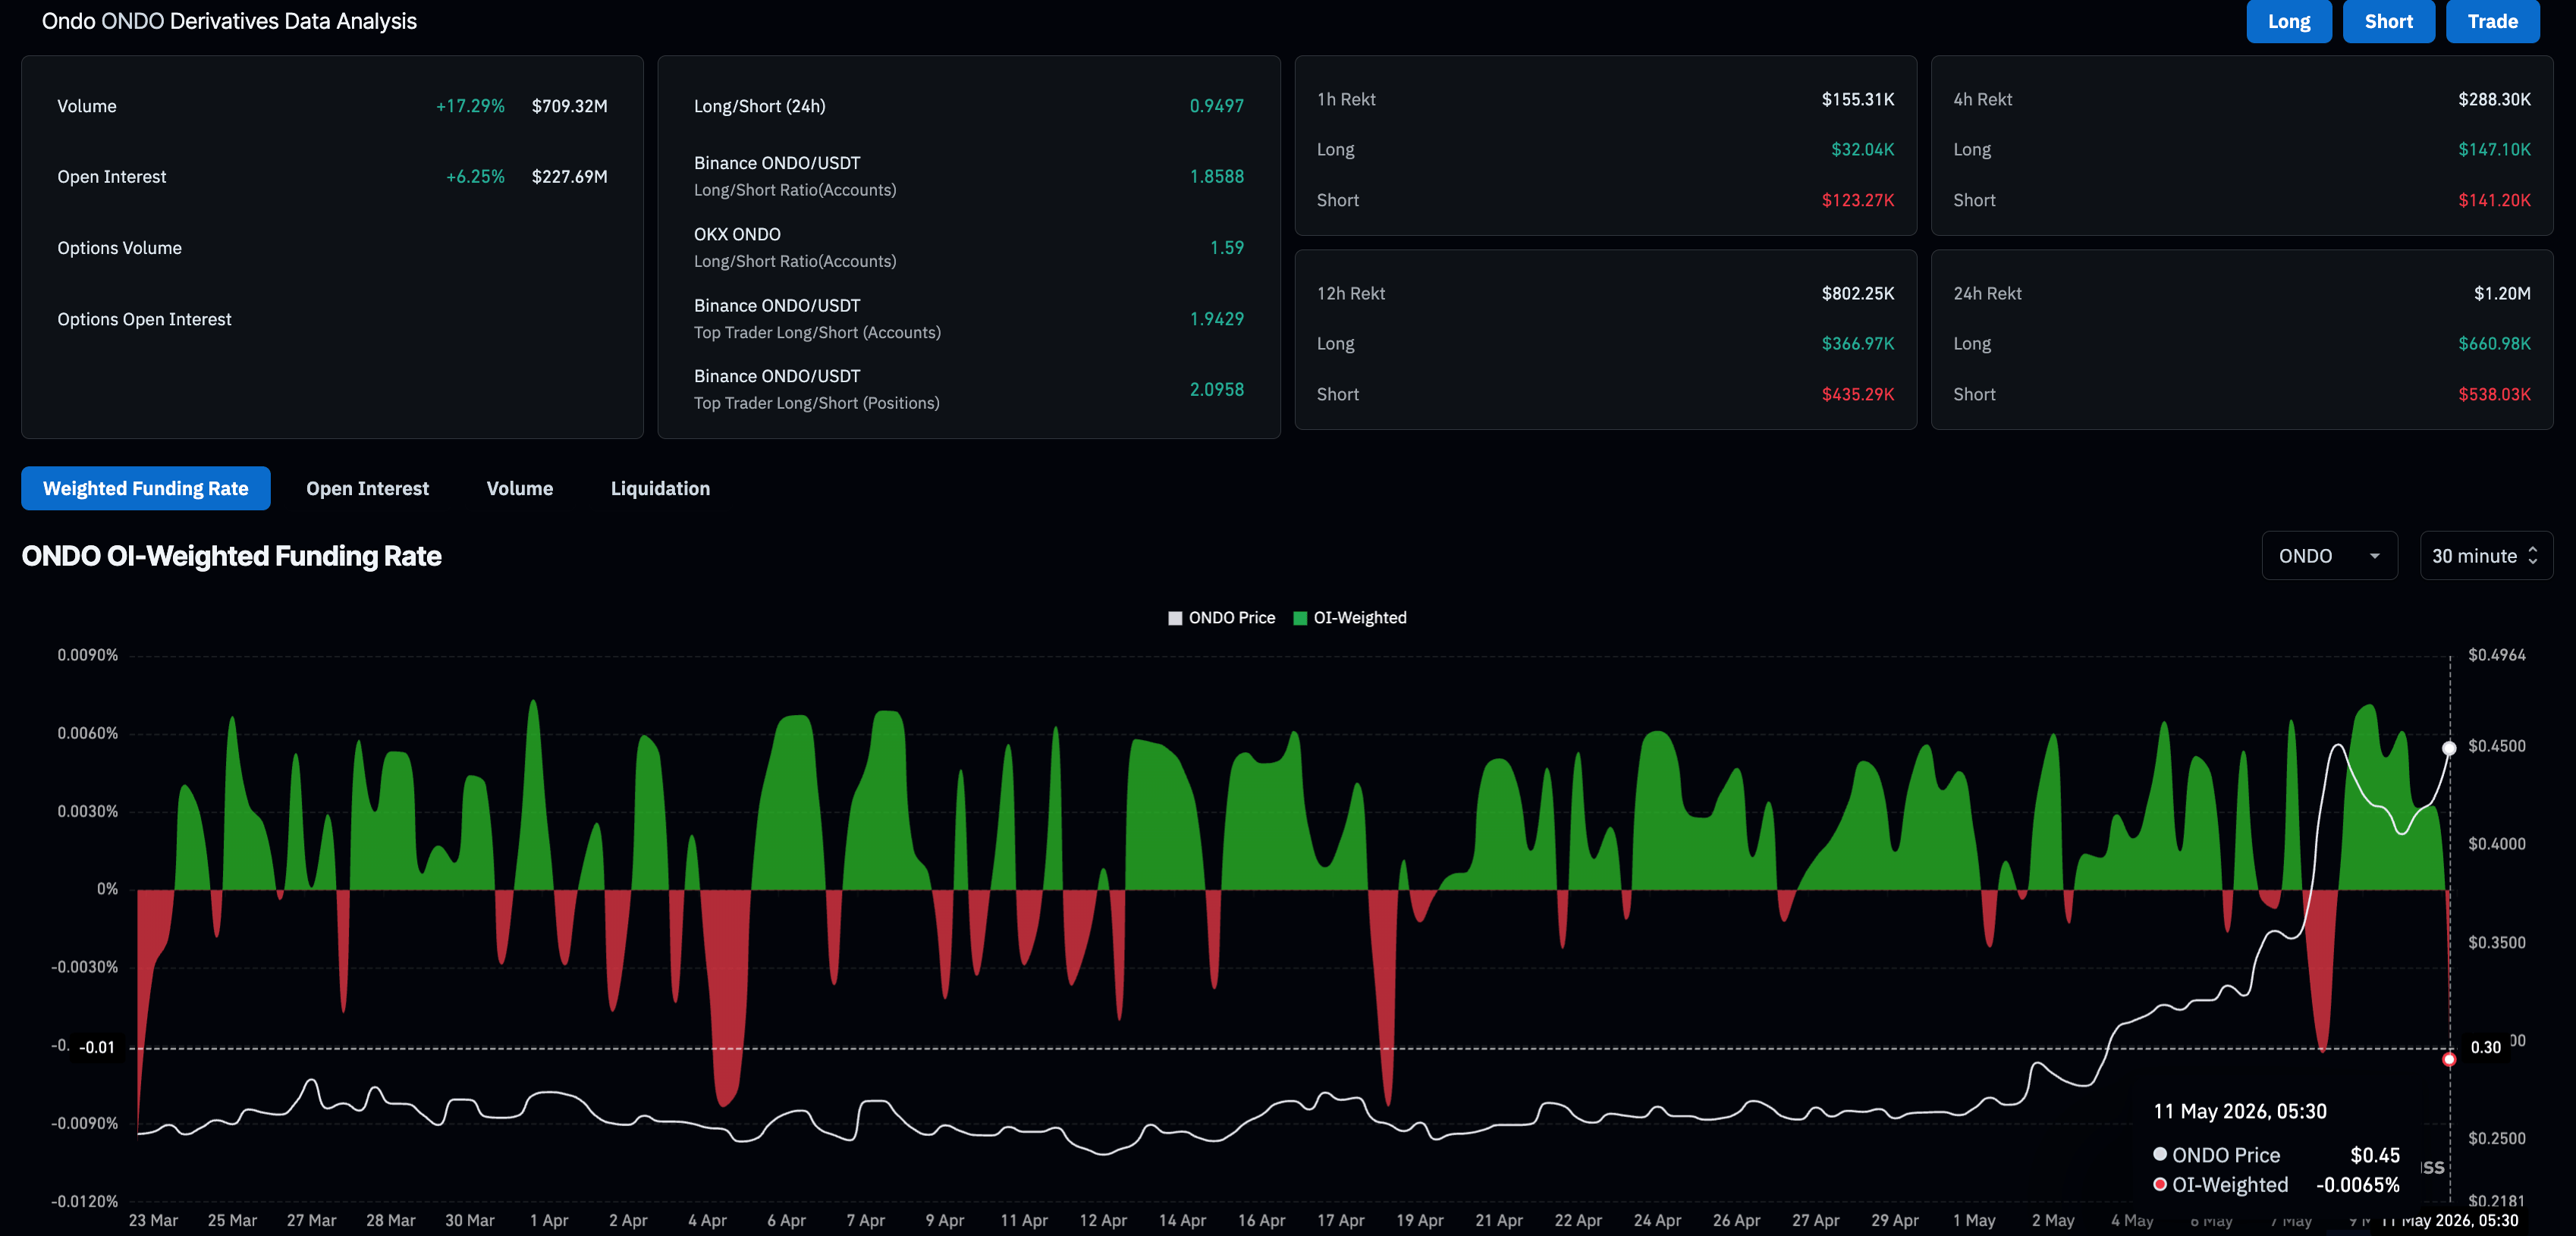
CoinGlass data shows the ONDO futures Open Interest is up 6% over the last 24 hours, reaching $227.69 million, implying steady positional buildup in the leverage market. However, the funding rate has flipped negative to -0.0065%, suggesting that traders are willing to pay a premium to hold short positions, anticipating a potential reversal.
Additionally, the long-to-short ratio of 0.9497 suggests a larger number of active short positions, while liquidations of $1.20 million over the last 24 hours, driven by $660,980 in long liquidations, reaffirm the reversal sentiment rising among traders.
Will ONDO prices stretch higher?
Ondo hovers around $0.4500 at press time on Monday, extending a strong bullish phase after breaking well above its 200-day EMA at $0.4022, with the 100-day EMA at $0.3103 and the 50-day EMA at $0.2993 trailing far below and preparing for a Golden Cross.
Momentum remains constructive, but signals are overheating as the Moving Average Convergence Divergence (MACD) rallies above the signal line on the daily chart with positive histogram bars expanding, though the Relative Strength Index (RSI) around 81 signals overbought conditions that could encourage consolidation or a corrective pause.
A decisive close above the $0.4524 resistance level, last tested on January 7, could further stretch the ONDO price above the $0.5000 psychological level, targeting the $0.5625 level, last seen on November 17.
On the downside, initial support is seen at the 200-day EMA near $0.4022, where a pullback could test the durability of the latest breakout. A deeper retracement would expose the next demand area around the 100-day EMA at $0.3103, followed by the 50-day EMA at $0.2993, where the broader bullish structure would likely come under pressure if broken decisively.
(The technical analysis of this story was written with the help of an AI tool.)

超過一百萬用戶依賴 FXStreet 獲取即時市場數據、圖表工具、專家洞見與外匯新聞。其全面的經濟日曆與教育網路研討會協助交易者保持資訊領先、做出審慎決策。FXStreet 擁有約 60 人的團隊,分布於巴塞隆納總部及全球各地。
閱讀更多


