
Pi Network Price Forecast: PI flashes bearish signals despite the Consensus 2026 spotlight
作者 Vishal Dixit
更新: 8 May 2026


熱門文章

Pi Network (PI) is trading below $0.1800 at press time on Friday, extending its third straight day of steady decline. Retail interest in Pi Network continues to decline, despite its co-founders' speeches at Consensus 2026 on Thursday, suggesting further buying pressure.
- Pi Network slips below $0.1800 on Friday, extending losses for the third consecutive day.
- Pi Network co-founder Nicolas Kokkalis delivered a talk on identity verification amid AI developments at Consensus 2026 on Thursday.
- The PI token risks breaking below a key support trendline near $0.1735 amid rising selling pressure.
Pi Network (PI) is trading below $0.1800 at press time on Friday, extending its third straight day of steady decline. Retail interest in Pi Network continues to decline, despite its co-founders' speeches at Consensus 2026 on Thursday, suggesting further buying pressure. The technical outlook for the PI token is cautiously bearish, with a risk of a break below a long-term rising support trendline near $0.1735.
Pi Network loses retail strength amid broader market decline
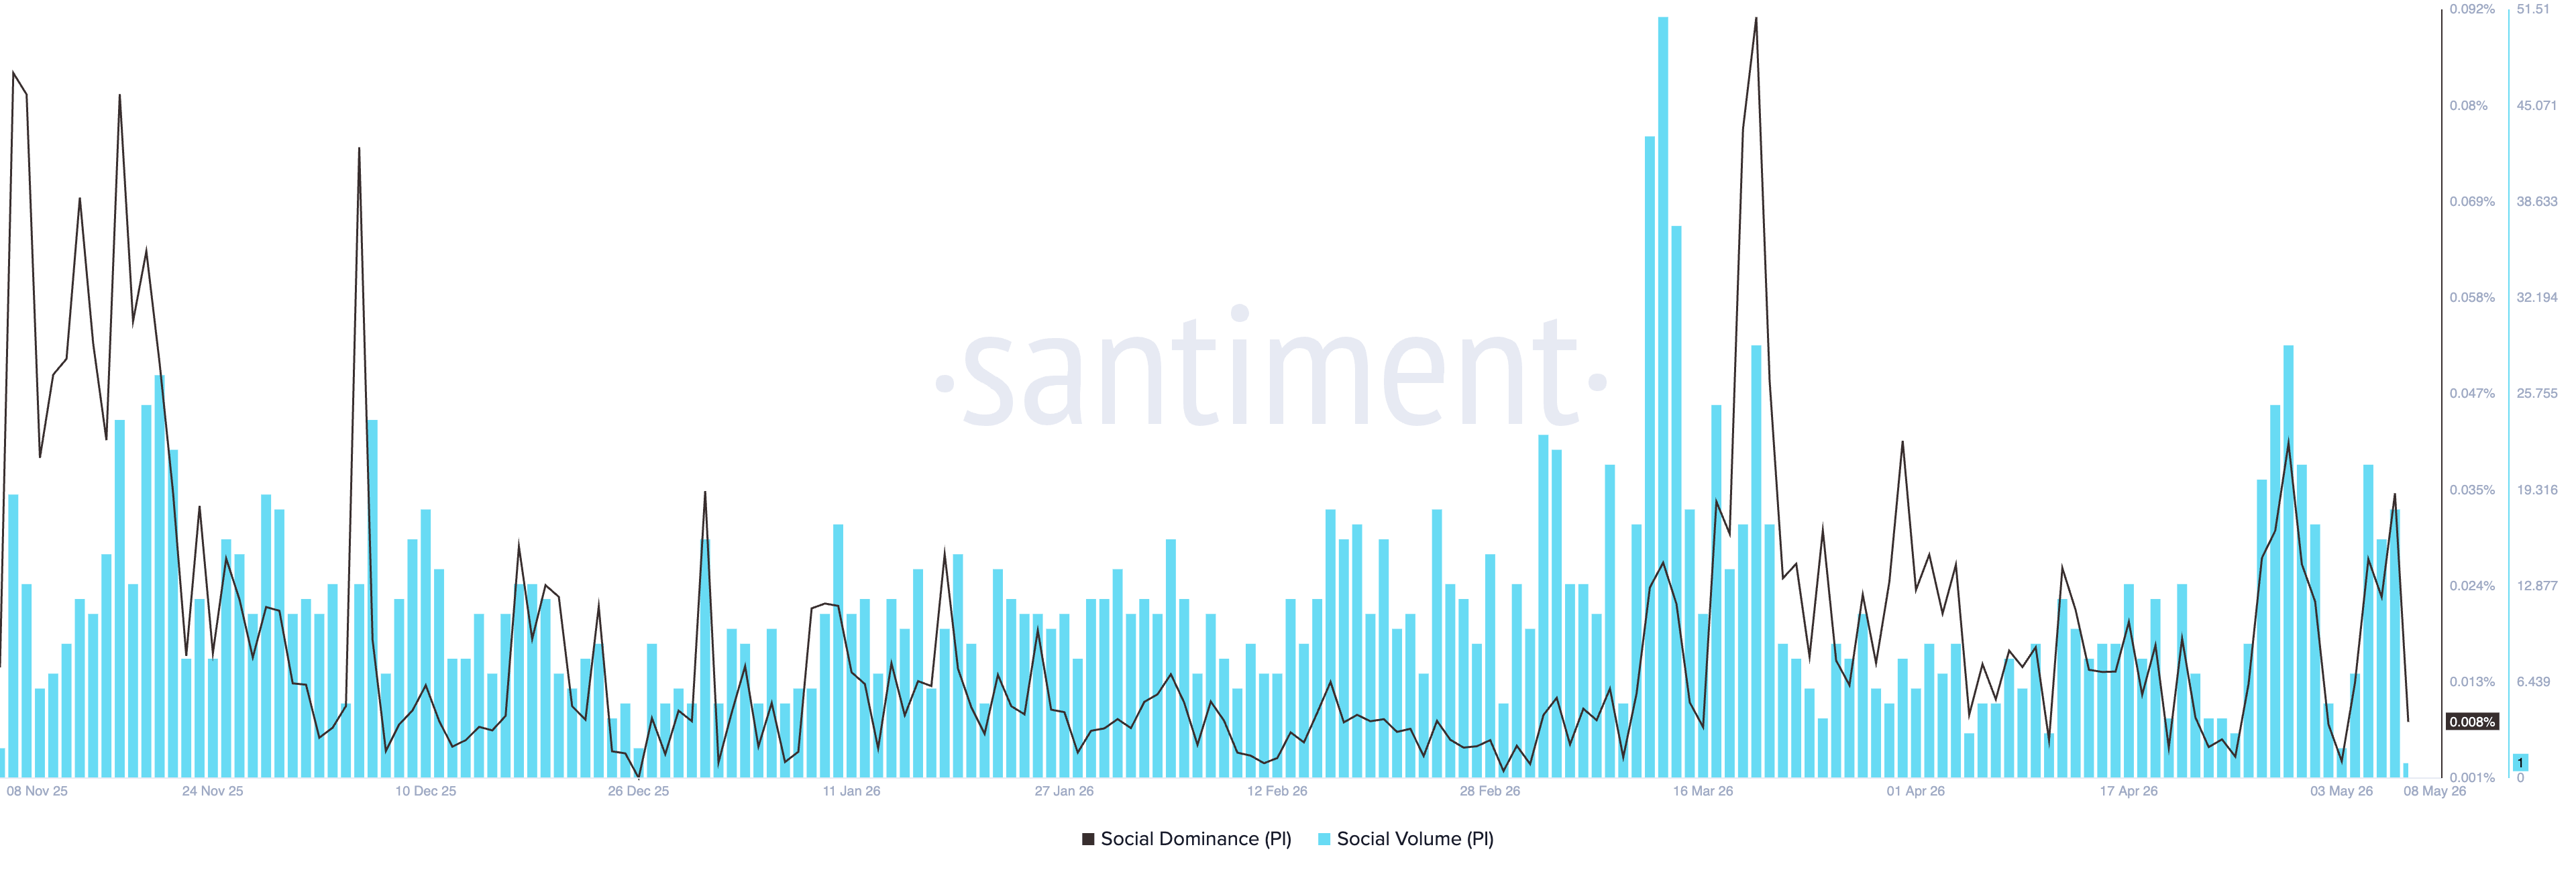
Pi Network co-founder Nicolas Kokkalis delivered a talk on identity verification amid AI developments at Consensus 2026 on Thursday, following Dr. Chengdiao Fan’s speech the previous day. Despite the focus on the Pi Network co-founders, the social buzz weakens as the broader market sentiment declines.
Santiment data shows the social dominance of Pi Network has dropped to 0.008%, down from 0.034% on Wednesday. On the other hand, the broader market sentiment returns to risk-off amid the renewed tensions between the US and Iran.
Technical outlook: Will Pi Network extend its decline?
Pi Network extends a three-day decline below $0.1750 at press time on Friday after the 100-day Exponential Moving Average (EMA) around $0.1845 capped the recovery on Wednesday. The pullback clears below the 50-day EMA near $0.1784, while the longer-term 200-day EMA is up at roughly $0.2293 reinforces a broader bearish structure.
Momentum also leans soft as the Relative Strength Index (RSI) at 46 on the daily chart hovers just below the midline, and the Moving Average Convergence Divergence (MACD) crosses below the signal line, turning the histogram bars mildly negative, suggesting downside risks persist while price stays capped beneath these overhead barriers.
If Pi Network closes below the rising support trendline near $0.1735 on a daily basis, it could confirm a bearish breakout from the triangle pattern. This downside release of trapped momentum could threaten the April 13 low at $0.1633, followed by a deeper support zone around the February 23 low at $0.1556.
On the topside, initial resistance is now seen at the 50- and 100-day EMAs at $0.1784 and $0.1845, respectively, aligning with the descending trendline break level near $0.1861. A daily close above this trendline could target the $0.2000 round figure before the 200-day EMA at $0.2293 comes into play as a more distant structural cap.
(The technical analysis of this story was written with the help of an AI tool.)

超過一百萬用戶依賴 FXStreet 獲取即時市場數據、圖表工具、專家洞見與外匯新聞。其全面的經濟日曆與教育網路研討會協助交易者保持資訊領先、做出審慎決策。FXStreet 擁有約 60 人的團隊,分布於巴塞隆納總部及全球各地。
閱讀更多


