
Pi Network Price Forecast: PI posts minor gains amid easing risk-off market sentiment
作者 Vishal Dixit
更新: 3 Jul 2026


熱門文章

Pi Network (PI) shows minor recovery on Friday, a slow follow-through of the 2% rebound from the previous day. The recovery in PI aligns with the easing broader market risk-off sentiment, fueling speculative interest in the token.
- Pi Network nears $0.1200 on Friday, following gains of over 2% the previous day.
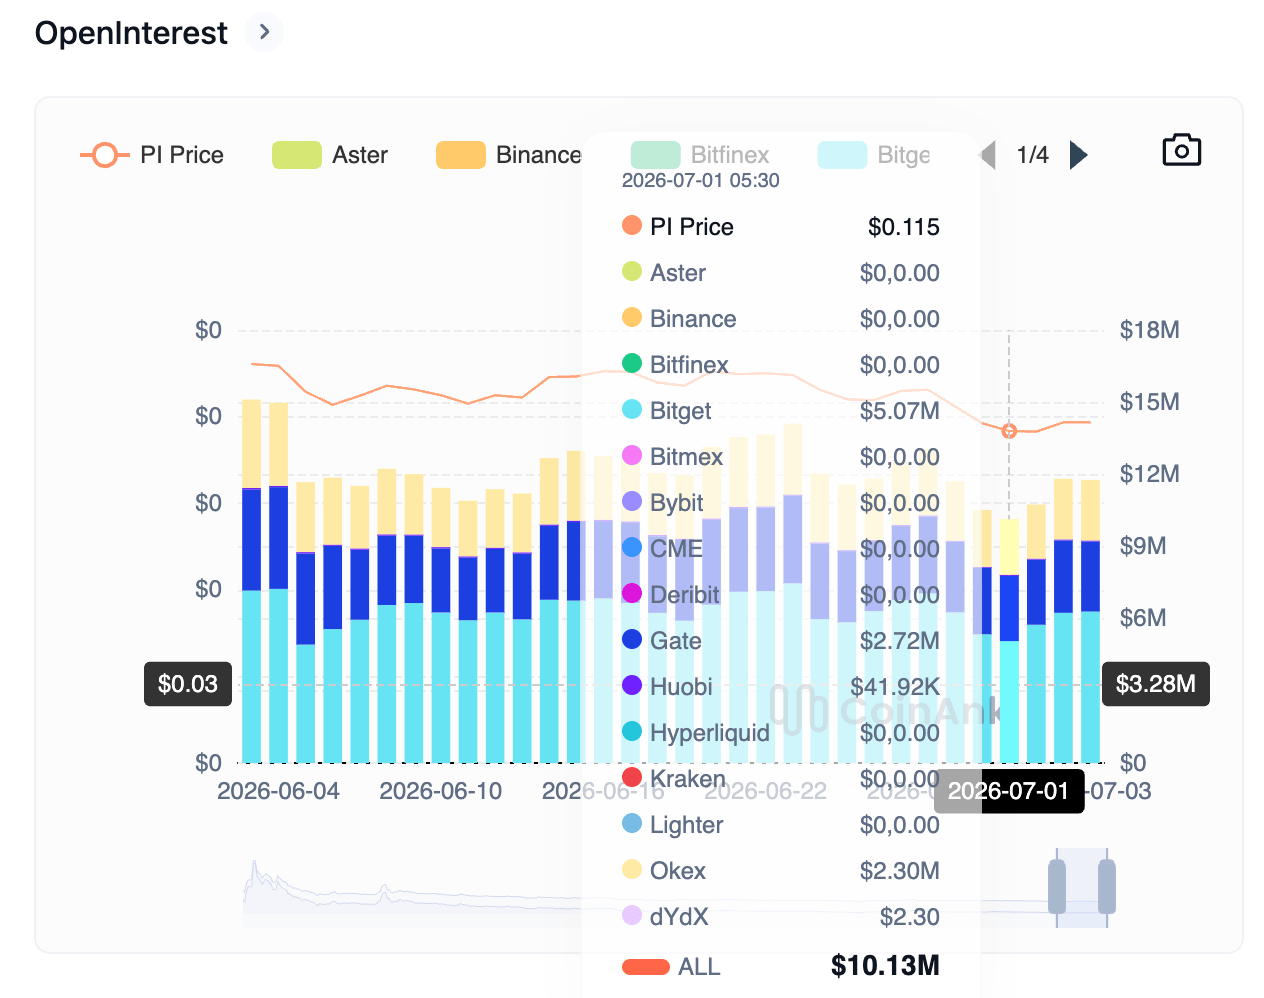
- Data shows a mild recovery in PI Open Interest, indicating speculative buildup among traders as broader market risk-off sentiment eases.
- The technical outlook for PI maintains a short-term upside bias as a throwback within a broader downside trend.
Pi Network (PI) shows minor recovery on Friday, a slow follow-through of the 2% rebound from the previous day. The recovery in PI aligns with the easing broader market risk-off sentiment, fueling speculative interest in the token. The technical outlook for PI indicates a potential near-term recovery within a broader downtrend.
Investors' mood shift boosts speculation about PI
The broader crypto market witnesses a mild recovery this week, with the US Federal Reserve Chairman Kevin Warsh acknowledging easing inflation risk and the lower-than-expected US Nonfarm Payroll data of 57,00 in June. The reduced expectations for further rate hikes ease downside pressure in the crypto market, lifting Bitcoin (BTC) above $60,000, in turn, boosting interest in altcoins.
“Until the policy outlook becomes clearer, Bitcoin and the broader crypto market are likely to remain range-bound, waiting for the next meaningful macro catalyst,” said Dean Chen, analyst at Bitunix.
Pi Network’s mild recovery aligns with the buildup of speculative interest among investors. CoinAnk data show that the PI token Open Interest (OI) stood at $11.8 million on Friday, up from a recent low of $10.3 million on Wednesday.
Will Pi Network extend its recovery?
PI token nears $0.1200 on Friday, extending its minor 2% gains from the previous day amid a broader declining trend. The 50-day Exponential Moving Average (EMA) at $0.1370 and the 200-day EMA at $0.1951 remain well above the price, suggesting that minor recoveries remain capped for now.
From a technical perspective, the 50-day EMA at $0.1370, near the P1 Pivot Level at $0.1397, serves as the immediate resistance level. A decisive close above this zone would confirm the short-term bullish bias.
The Moving Average Convergence Divergence (MACD) stays in negative territory but hints at a potential crossover above the signal line. Meanwhile, the Relative Strength Index (RSI) at 34 exits the oversold zone with an uptick, suggesting downside pressure is likely easing from the oversold conditions seen earlier in the month.
On the downside, Pi Network's record low of $0.1111, set on Tuesday, serves as the crucial support floor, where a slip could expose the S1 Pivot Level at $0.1010.
(The technical analysis of this story was written with the help of an AI tool.)

超過一百萬用戶依賴 FXStreet 獲取即時市場數據、圖表工具、專家洞見與外匯新聞。其全面的經濟日曆與教育網路研討會協助交易者保持資訊領先、做出審慎決策。FXStreet 擁有約 60 人的團隊,分布於巴塞隆納總部及全球各地。
閱讀更多


