
Pi Network Price Forecast: PI signals rebound chances amid new mainnet upgrade
作者 Vishal Dixit
更新: 20 May 2026


熱門文章

Pi Network (PI) extends losses in a downward spiral below $0.1500 at press time on Wednesday, overlooking the major mainnet nodes upgrade to protocol version 23.
- Pi Network edges below $0.1500 on Wednesday, extending losses for the sixth straight day.
- Pi Core Team announces that major mainnet nodes have updated to protocol version 23.
- The technical outlook is mixed, as a positive RSI divergence suggests a rebound possibility.
Pi Network (PI) extends losses in a downward spiral below $0.1500 at press time on Wednesday, overlooking the major mainnet nodes upgrade to protocol version 23. Technically, PI shows a rebound possibility from the previous day’s low at $0.1463 as the RSI indicator flashes a positive divergence on a shorter timeframe.
Major mainnet nodes push forward
Pi Core Team announced on Wednesday that major mainnet nodes have upgraded to Stellar protocol version 23, as the underlying infrastructure is the Stellar blockchain. The upgrade includes an operating system update from Ubuntu 20 to 24 and a database engine update from PostgreSQL 12 to 16.

Will Pi Network bounce back?
Pi Network hovers around $0.1475 at press time on Wednesday, holding a bearish bias as price holds below the 50-period Exponential Moving Average (EMA) at roughly $0.1605 and the 200-period EMA near $0.1709.
At the same time, the Relative Strength Index (RSI) near 29 signals an overextended downside and a positive divergence as price approaches the previous day's low at $0.1463. Typically, such positive divergences lead to an upside reversal, which could target a declining trendline around $0.1519.
Meanwhile, the flat Moving Average Convergence Divergence (MACD) below the zero line hints at weak downside momentum but no clear recovery signal yet.
On the topside, a daily close above $0.1519 could extend a breakout rally toward the 50-EMA at $0.1605, with the 200-EMA at $0.1709.
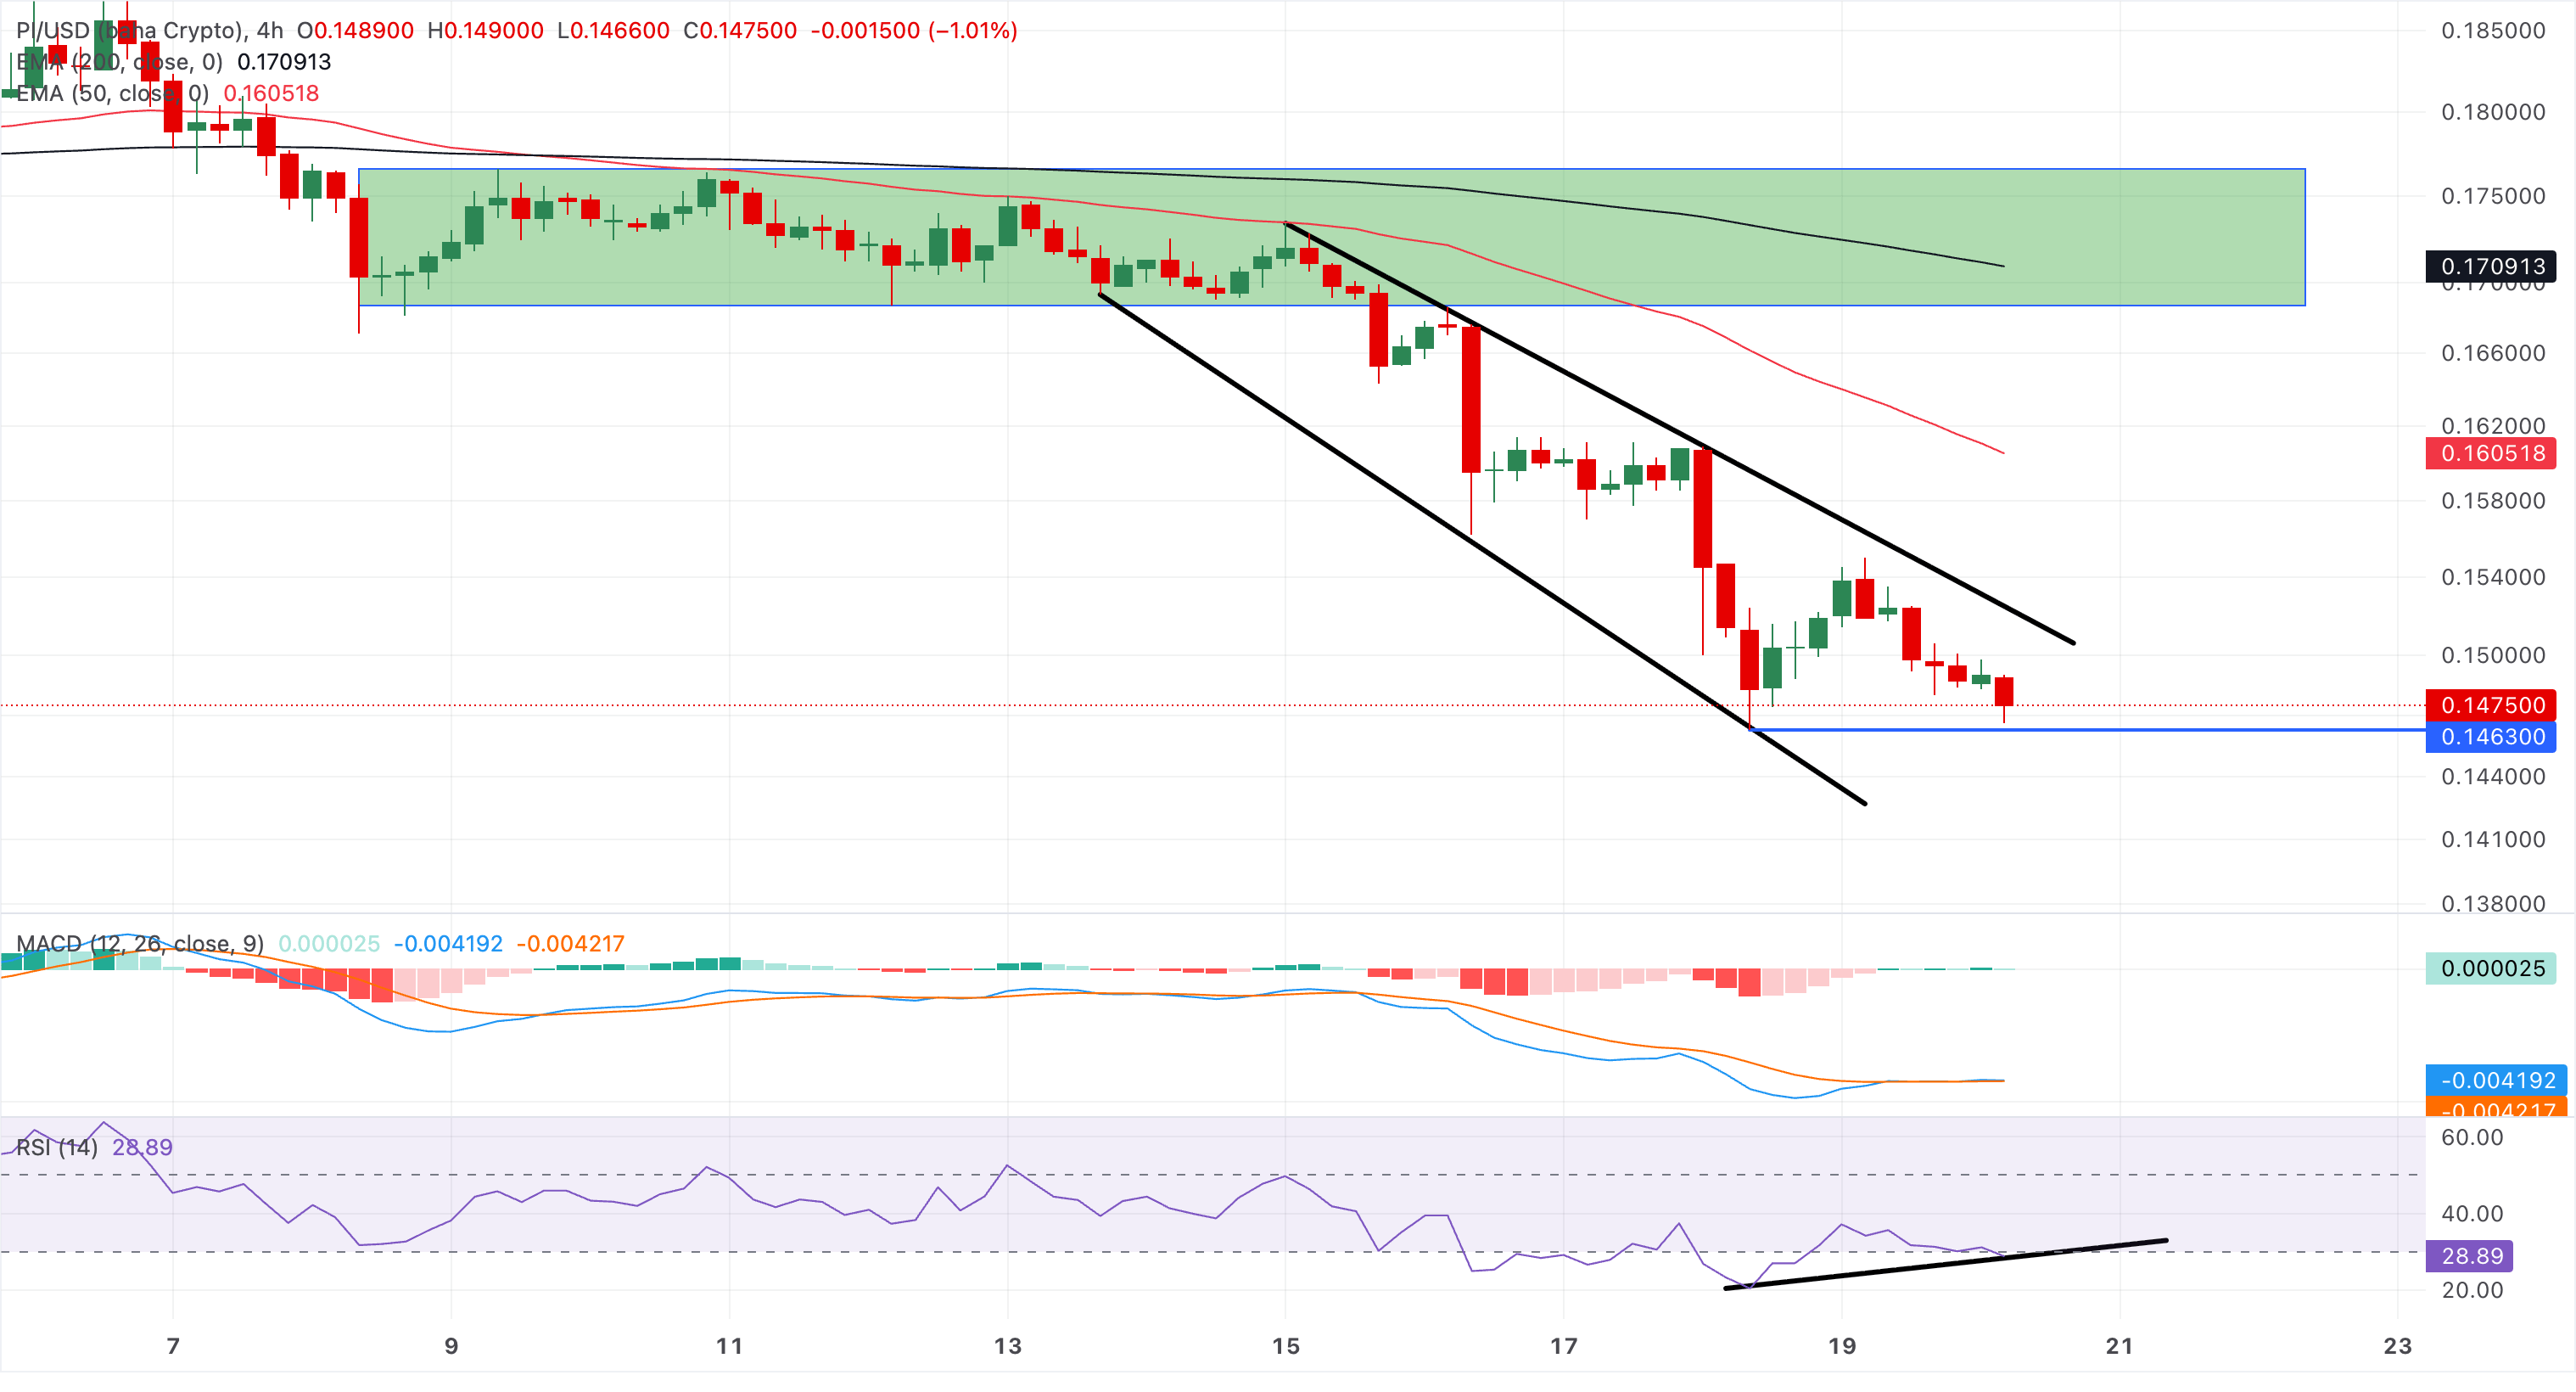
On the downside, Tuesday's low at $0.1463 serves as a key support level, and a daily close below it would nullify rebound chances.
(The technical analysis of this story was written with the help of an AI tool.)

超過一百萬用戶依賴 FXStreet 獲取即時市場數據、圖表工具、專家洞見與外匯新聞。其全面的經濟日曆與教育網路研討會協助交易者保持資訊領先、做出審慎決策。FXStreet 擁有約 60 人的團隊,分布於巴塞隆納總部及全球各地。
閱讀更多


