
Pi Network Price Forecast: PI slides below $0.18 as bearish sentiment builds
作者 Vishal Dixit
發布日期: 18 Mar 2026 | 修改日期: 18 Mar 2026


熱門文章

Pi Network (PI) edges below $0.1800 at press time on Wednesday, extending the 10% drop from the previous day. A surge in social chatter around the PI token aligns with this drop, suggesting a bearish incline in retail sentiment.
- Pi Network extends losses below $0.1800 on Wednesday, risking further decline.
- The rebound in social chatter around Pi Network aligns with the roughly 10% decline on Tuesday, skewing the sentiment bearish.
- The technical outlook is bearish, as the MACD and RSI indicators signal a sell-side bias.
Pi Network (PI) edges below $0.1800 at press time on Wednesday, extending the 10% drop from the previous day. A surge in social chatter around the PI token aligns with this drop, suggesting a bearish incline in retail sentiment. The technical outlook for PI highlights the risk of further losses as selling pressure builds.
Retail interest builds, but bearish
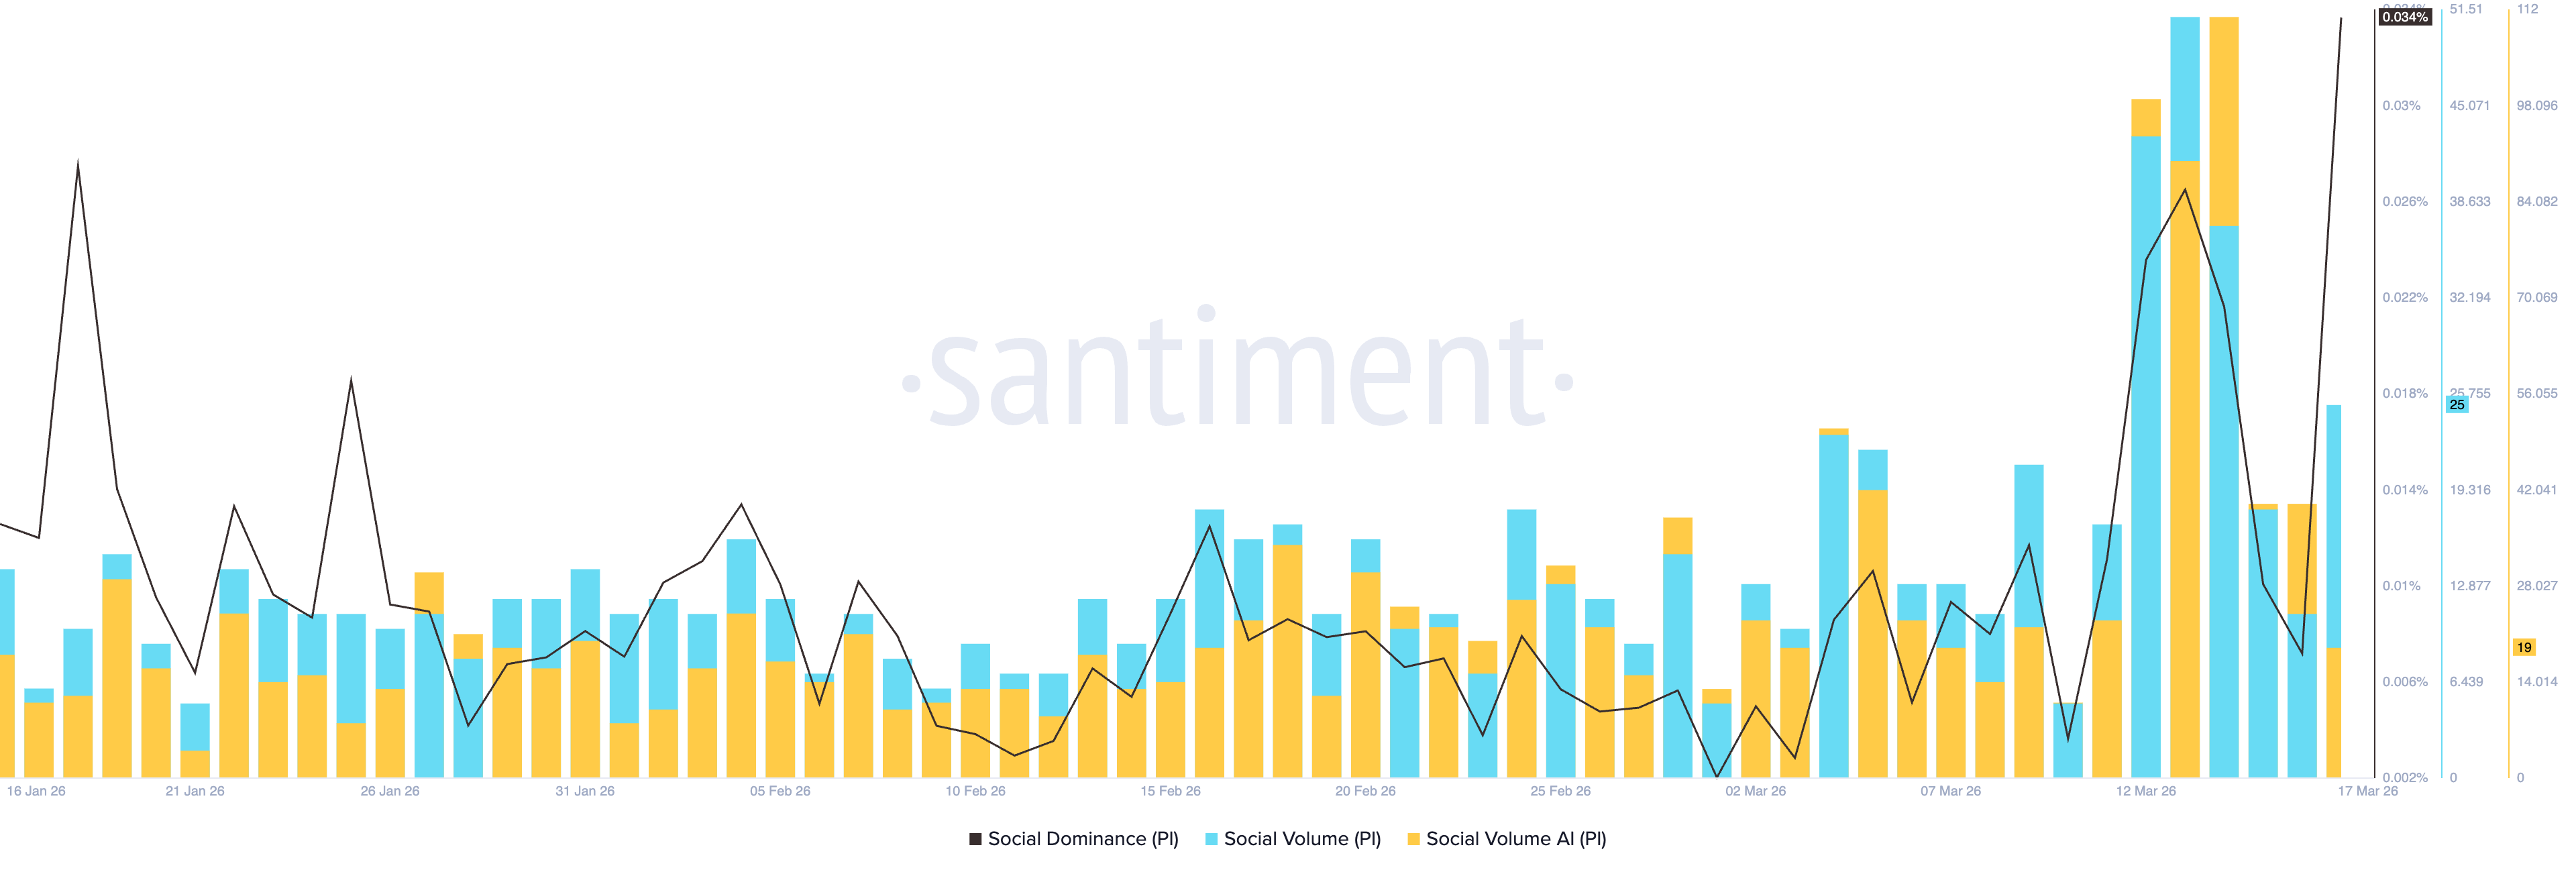
Santiment data shows that the social dominance of PI surged to 0.034% on Tuesday, marking its share of social volume among the top 100 cryptocurrencies, as its social volume jumped to 25. However, the increase in social chatter aligns with the PI token's pullback after Pi Day celebrations, suggesting a potential bearish market trend.
Will Pi Network extend losses to $0.15?
Pi Network is down 2% at press time on Wednesday, approaching the resistance-turned-support zone near $0.1736, marked by a swing high in late February. The near-term bias is cautiously bearish as PI slips below the 50-day Exponential Moving Average (EMA) at $0.1892 and holds well under the 100-day and 200-day EMAs, which cap the broader trend.
Additionally, PI drops below the broken descending resistance trendline, nullifying the breakout rally. Momentum confirms the rise in bearish pressure, as the Moving Average Convergence Divergence (MACD) line now runs below its signal line with a widening negative histogram, while the Relative Strength Index (RSI) at 44 shows bearish momentum but not oversold stress.
On the downside, immediate support sits at $0.1736, and a break below this level would open the door to the prior reaction floor around the October 10 low of $0.1533. A sustained loss of $0.15 would expose a deeper retracement toward the listing price of $0.1000.
The initial resistance emerges at the former break area, close to the 50-day EMA at $0.1892. A daily close above this level would be needed to ease immediate downside pressure, potentially lifting the PI token to the R1 Pivot Point at $0.2081.
(The technical analysis of this story was written with the help of an AI tool.)

超過一百萬用戶依賴 FXStreet 獲取即時市場數據、圖表工具、專家洞見與外匯新聞。其全面的經濟日曆與教育網路研討會協助交易者保持資訊領先、做出審慎決策。FXStreet 擁有約 60 人的團隊,分布於巴塞隆納總部及全球各地。
閱讀更多


