
Pump.fun breaks out as meme coin activity soars, driving revenue above $2.3 million
作者 John Isige
發布日期: 27 Jan 2026 | 修改日期: 27 Jan 2026


熱門文章

Pump.fun (PUMP) is rebounding above $0.00300 at the time of writing on Tuesday, outpacing major crypto assets like Bitcoin (BTC), which continues to trade sideways between support at $88,000 and resistance at $90,000.
- Pump.fun reclaims the $0.00300 support level, suggesting that investors are turning to meme coins as Bitcoin consolidates.
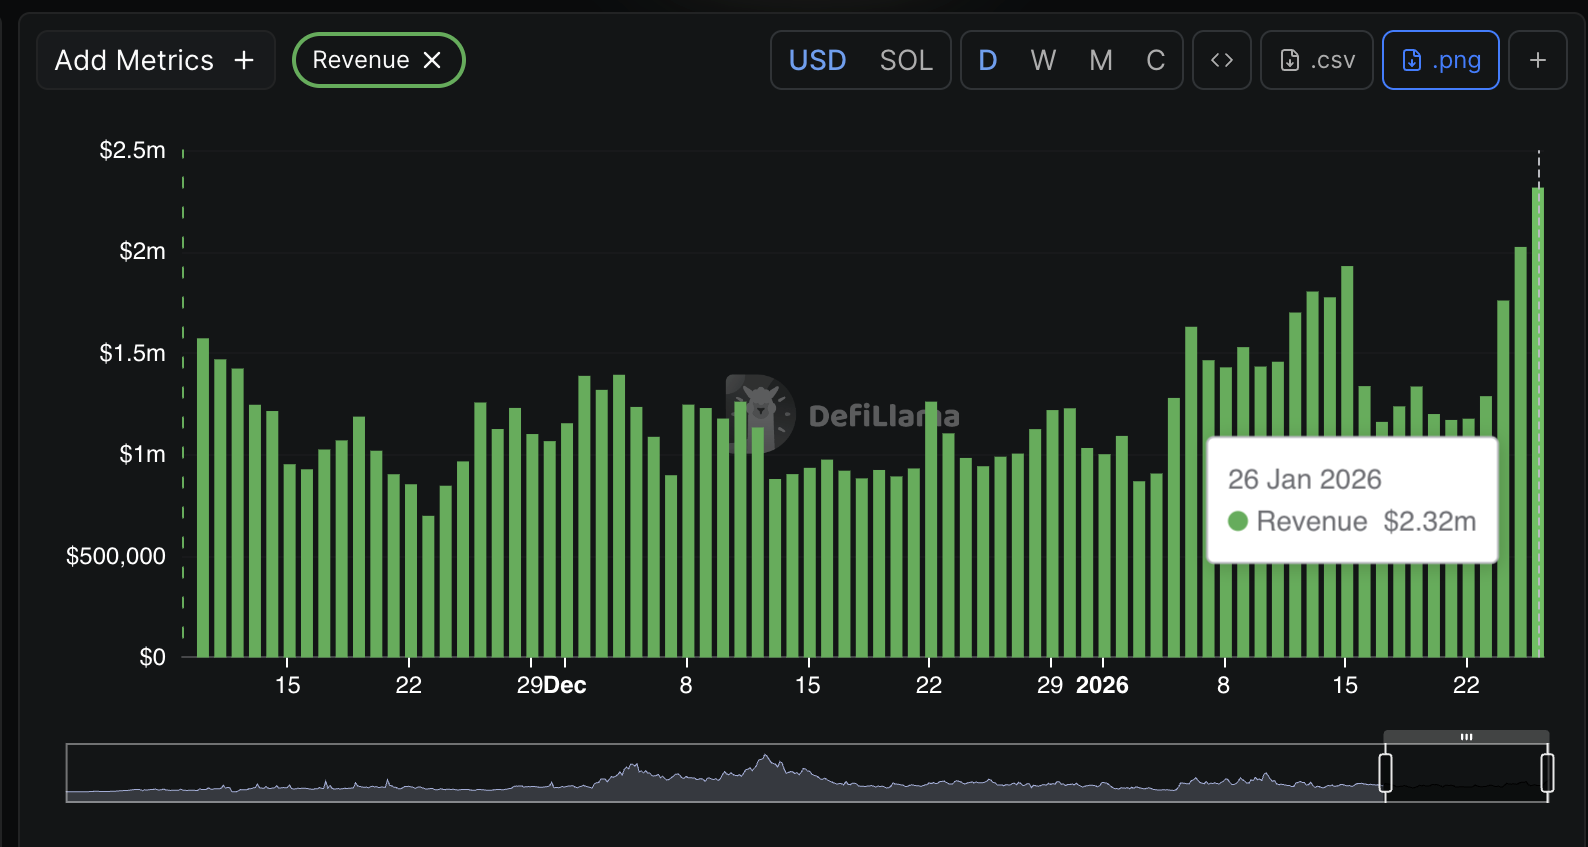
- Pump.fun’s meme coin launchpad revenue rises for five consecutive days, reaching $2.3 million on Monday.
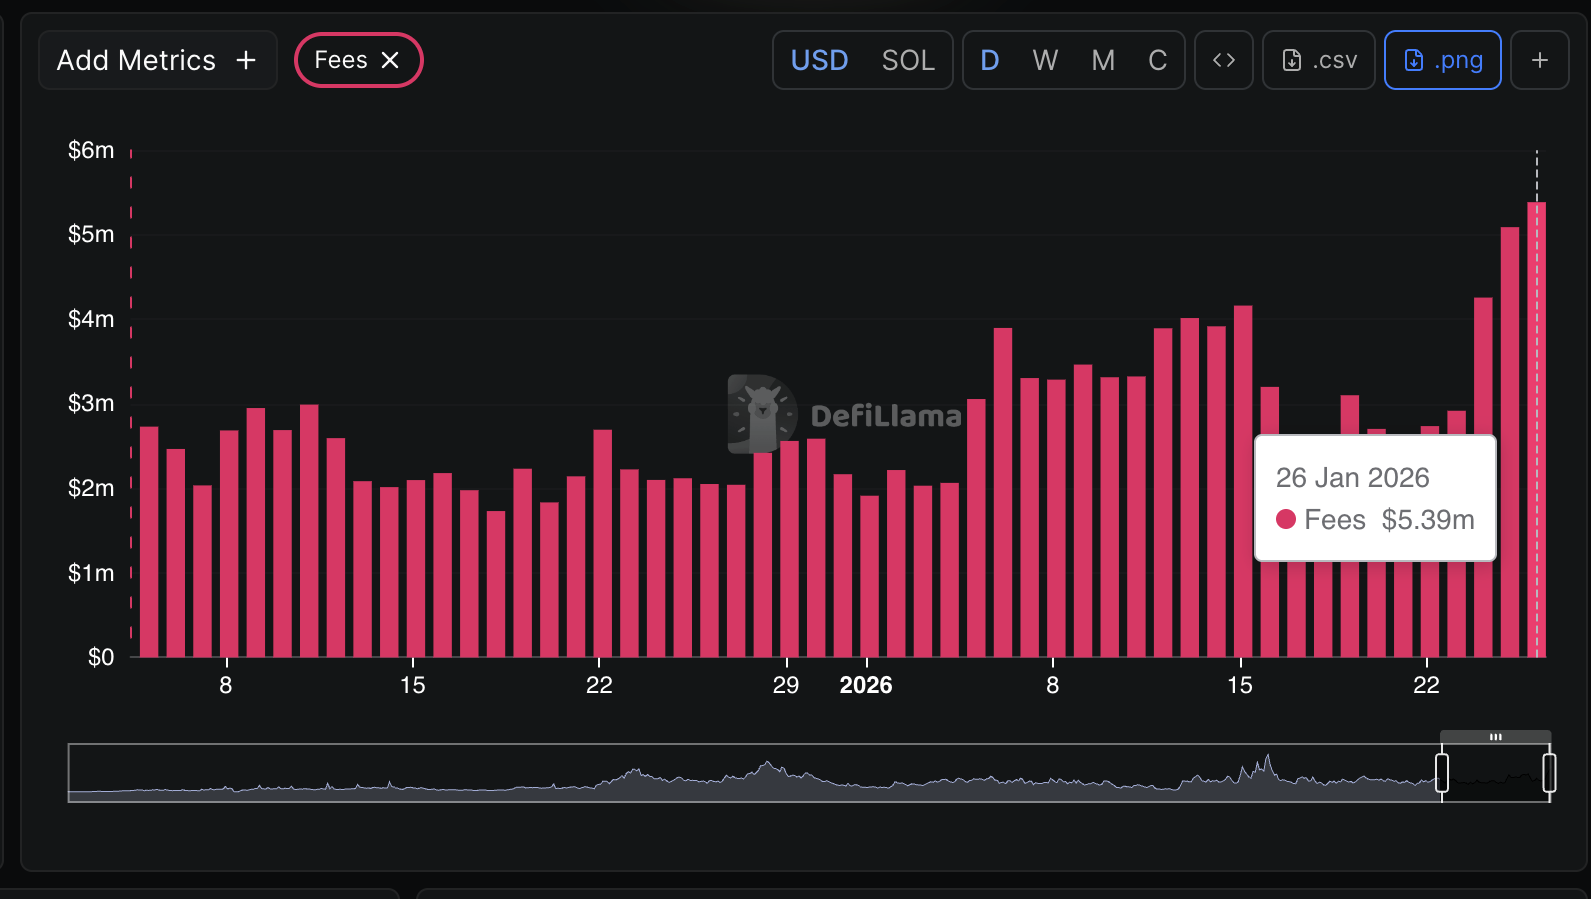
- Pump.fun’s combined trading and meme coin launching fees surge to $5.4 million, up over 21% since Sunday.
Pump.fun (PUMP) is rebounding above $0.00300 at the time of writing on Tuesday, outpacing major crypto assets like Bitcoin (BTC), which continues to trade sideways between support at $88,000 and resistance at $90,000.
Pump.fun revenue, fees surge as price rallies
Pump.fun’s meme coin launchpad and trading platform revenue has increased significantly, totalling $2.32 million on Monday from $2.02 on Sunday and $1.18 million last Thursday. The total revenue returned above the $1 million mark on January 5, after dropping to $869,000 on January 3.
The fees collected from trading and launching meme coins have also increased by more than 21% to $5.4 million as of Monday from $2.7 million on Thursday. This surge suggests that meme coin launches and trading activity are gaining momentum among investors seeking alternative opportunities to major crypto assets.
Revenue and fees on Pump.fun play a significant role, supporting the token buyback program. A significant portion of the revenue and fees collected is used to reduce PUMP’s circulating supply, with the rest used to fund staking rewards.
Technical outlook: Pump eyes further upside as bulls look to follow through
Pump holds above the immediate support at $0.00300, supported by strengthening technical indicators and positive sentiment among traders. The Relative Strength Index (RSI) is above 60 on the tail chart, indicating short-term bullish momentum.
The Moving Average Convergence Divergence (MACD) is above its signal line, prompting investors to lean into risk and adding to the tailwind driving PUMP higher. Bulls will tighten their grip further as the green histogram bars expand above the zero line. A break above the next key hurdle at $0.00339, last tested in early December, is required to boost recovery toward $0.00400.
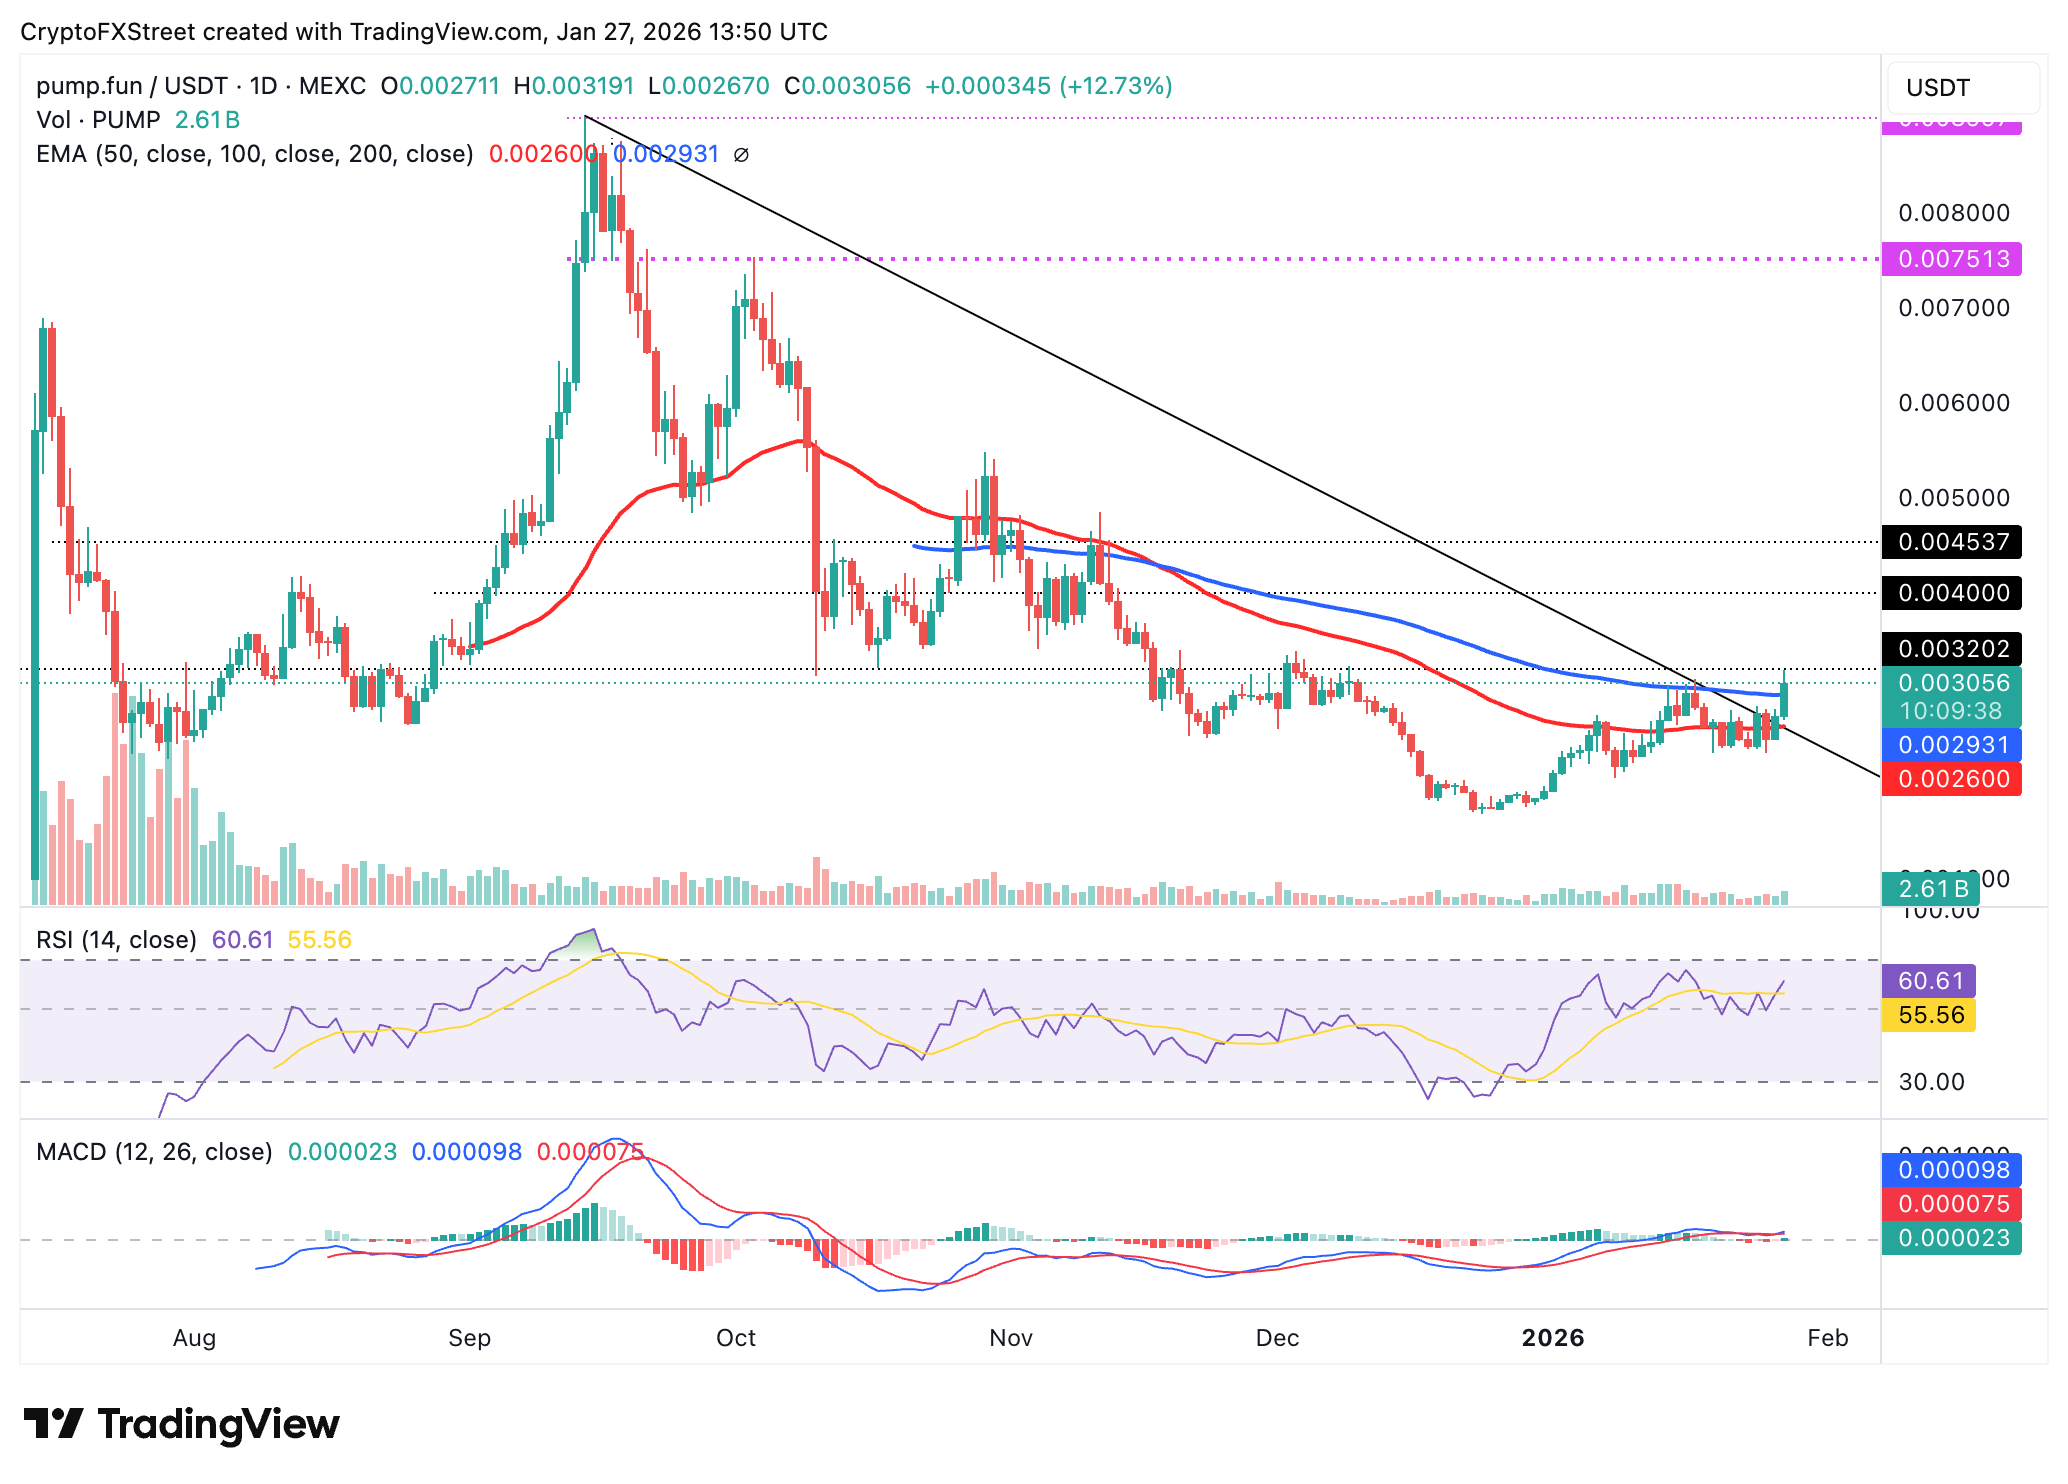
Still, traders should be cautious amid possible profit-taking, microeconomic uncertainty, and geopolitical tensions, which could push PUMP below $0.00300. The 100-day Exponential Moving Average (EMA) is poised to absorb selling pressure at $0.00293 and the 50-day EMA at $0.00260.
Cryptocurrency metrics FAQs
The developer or creator of each cryptocurrency decides on the total number of tokens that can be minted or issued. Only a certain number of these assets can be minted by mining, staking or other mechanisms. This is defined by the algorithm of the underlying blockchain technology. On the other hand, circulating supply can also be decreased via actions such as burning tokens, or mistakenly sending assets to addresses of other incompatible blockchains.
Market capitalization is the result of multiplying the circulating supply of a certain asset by the asset’s current market value.
Trading volume refers to the total number of tokens for a specific asset that has been transacted or exchanged between buyers and sellers within set trading hours, for example, 24 hours. It is used to gauge market sentiment, this metric combines all volumes on centralized exchanges and decentralized exchanges. Increasing trading volume often denotes the demand for a certain asset as more people are buying and selling the cryptocurrency.
Funding rates are a concept designed to encourage traders to take positions and ensure perpetual contract prices match spot markets. It defines a mechanism by exchanges to ensure that future prices and index prices periodic payments regularly converge. When the funding rate is positive, the price of the perpetual contract is higher than the mark price. This means traders who are bullish and have opened long positions pay traders who are in short positions. On the other hand, a negative funding rate means perpetual prices are below the mark price, and hence traders with short positions pay traders who have opened long positions.

超過一百萬用戶依賴 FXStreet 獲取即時市場數據、圖表工具、專家洞見與外匯新聞。其全面的經濟日曆與教育網路研討會協助交易者保持資訊領先、做出審慎決策。FXStreet 擁有約 60 人的團隊,分布於巴塞隆納總部及全球各地。
閱讀更多


