
XRP dips as bearish pressure persists despite ETF growth
作者 John Isige
發布日期: 16 Dec 2025 | 修改日期: 16 Dec 2025


熱門文章

Ripple (XRP) is finding footing above $1.90 at the time of writing on Tuesday after a bearish wave swept across the broader cryptocurrency market, building on persistent negative sentiment.
- XRP bulls are overwhelmed by sell-side pressure as losses pile up.
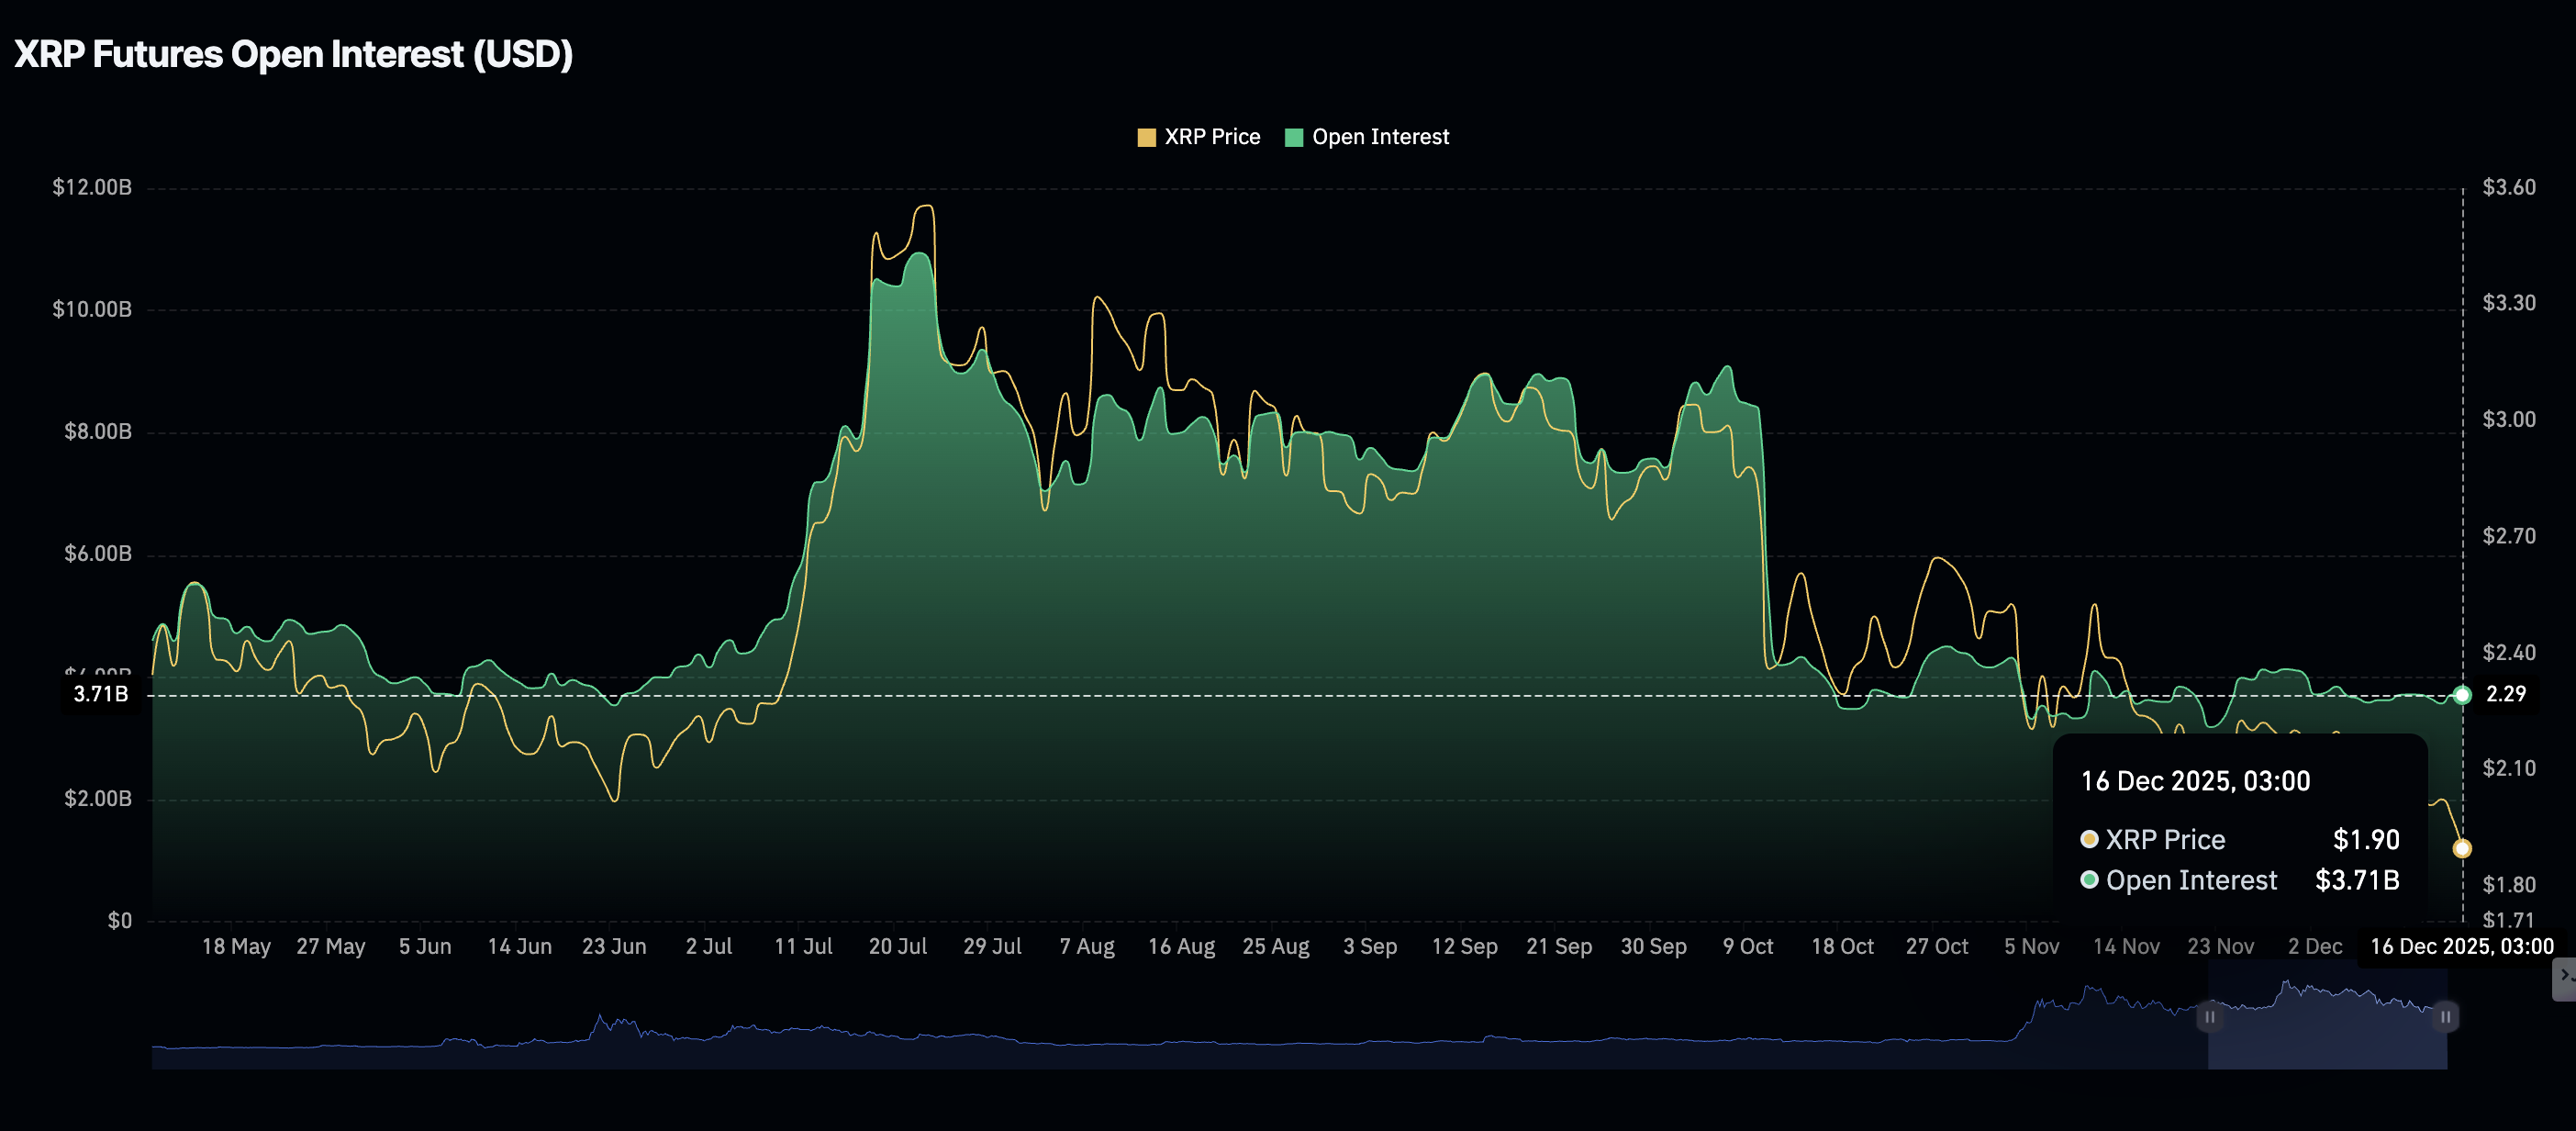
- XRP retail demand remains significantly suppressed, with futures Open Interest averaging $3.71 billion.
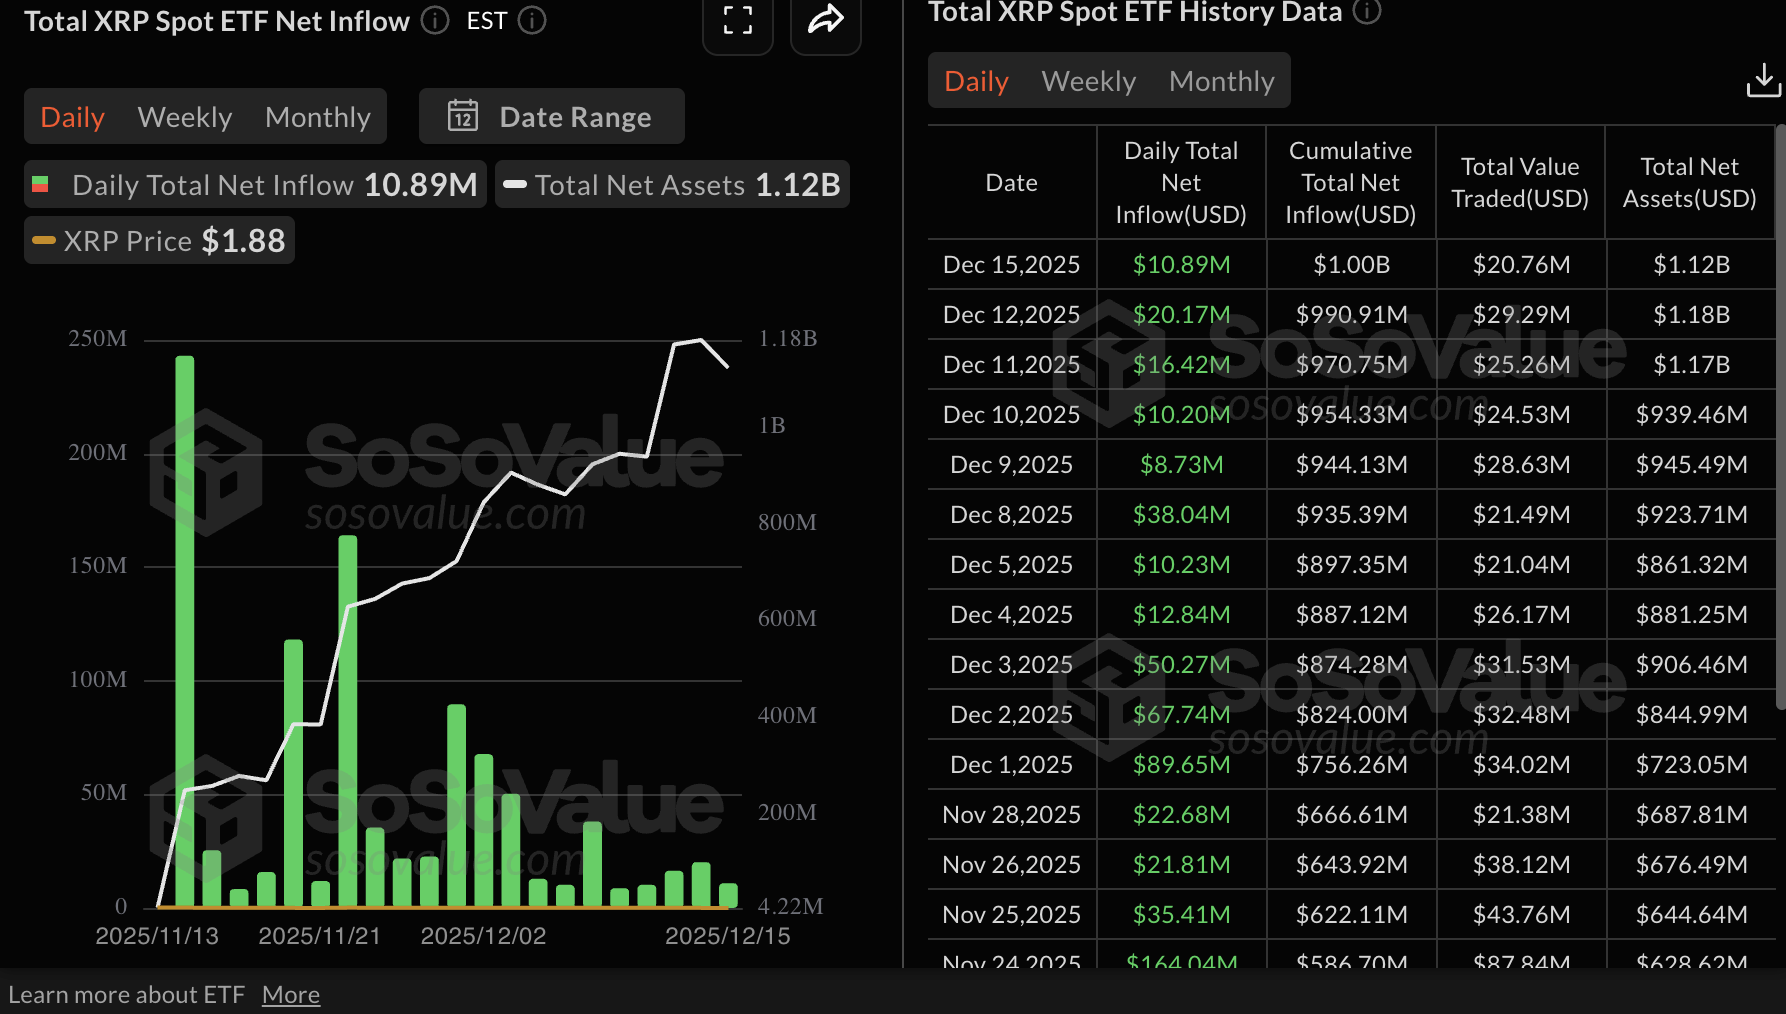
- Prices fail to react to encouraging data from ETFs, which have sustained 21 days of inflows, and total volume has reached $1 billion.
Ripple (XRP) is finding footing above $1.90 at the time of writing on Tuesday after a bearish wave swept across the broader cryptocurrency market, building on persistent negative sentiment.
XRP trades under pressure amid low retail interest
Retail interest in XRP remains significantly low, with the futures Open Interest (OI) at $3.71 billion on Tuesday, down from $3.72 billion the previous day. Demand for XRP derivatives has not recovered since the October 10 crash, which liquidated $610 million in long positions and $90 million in shorts, according to CoinGlass data.
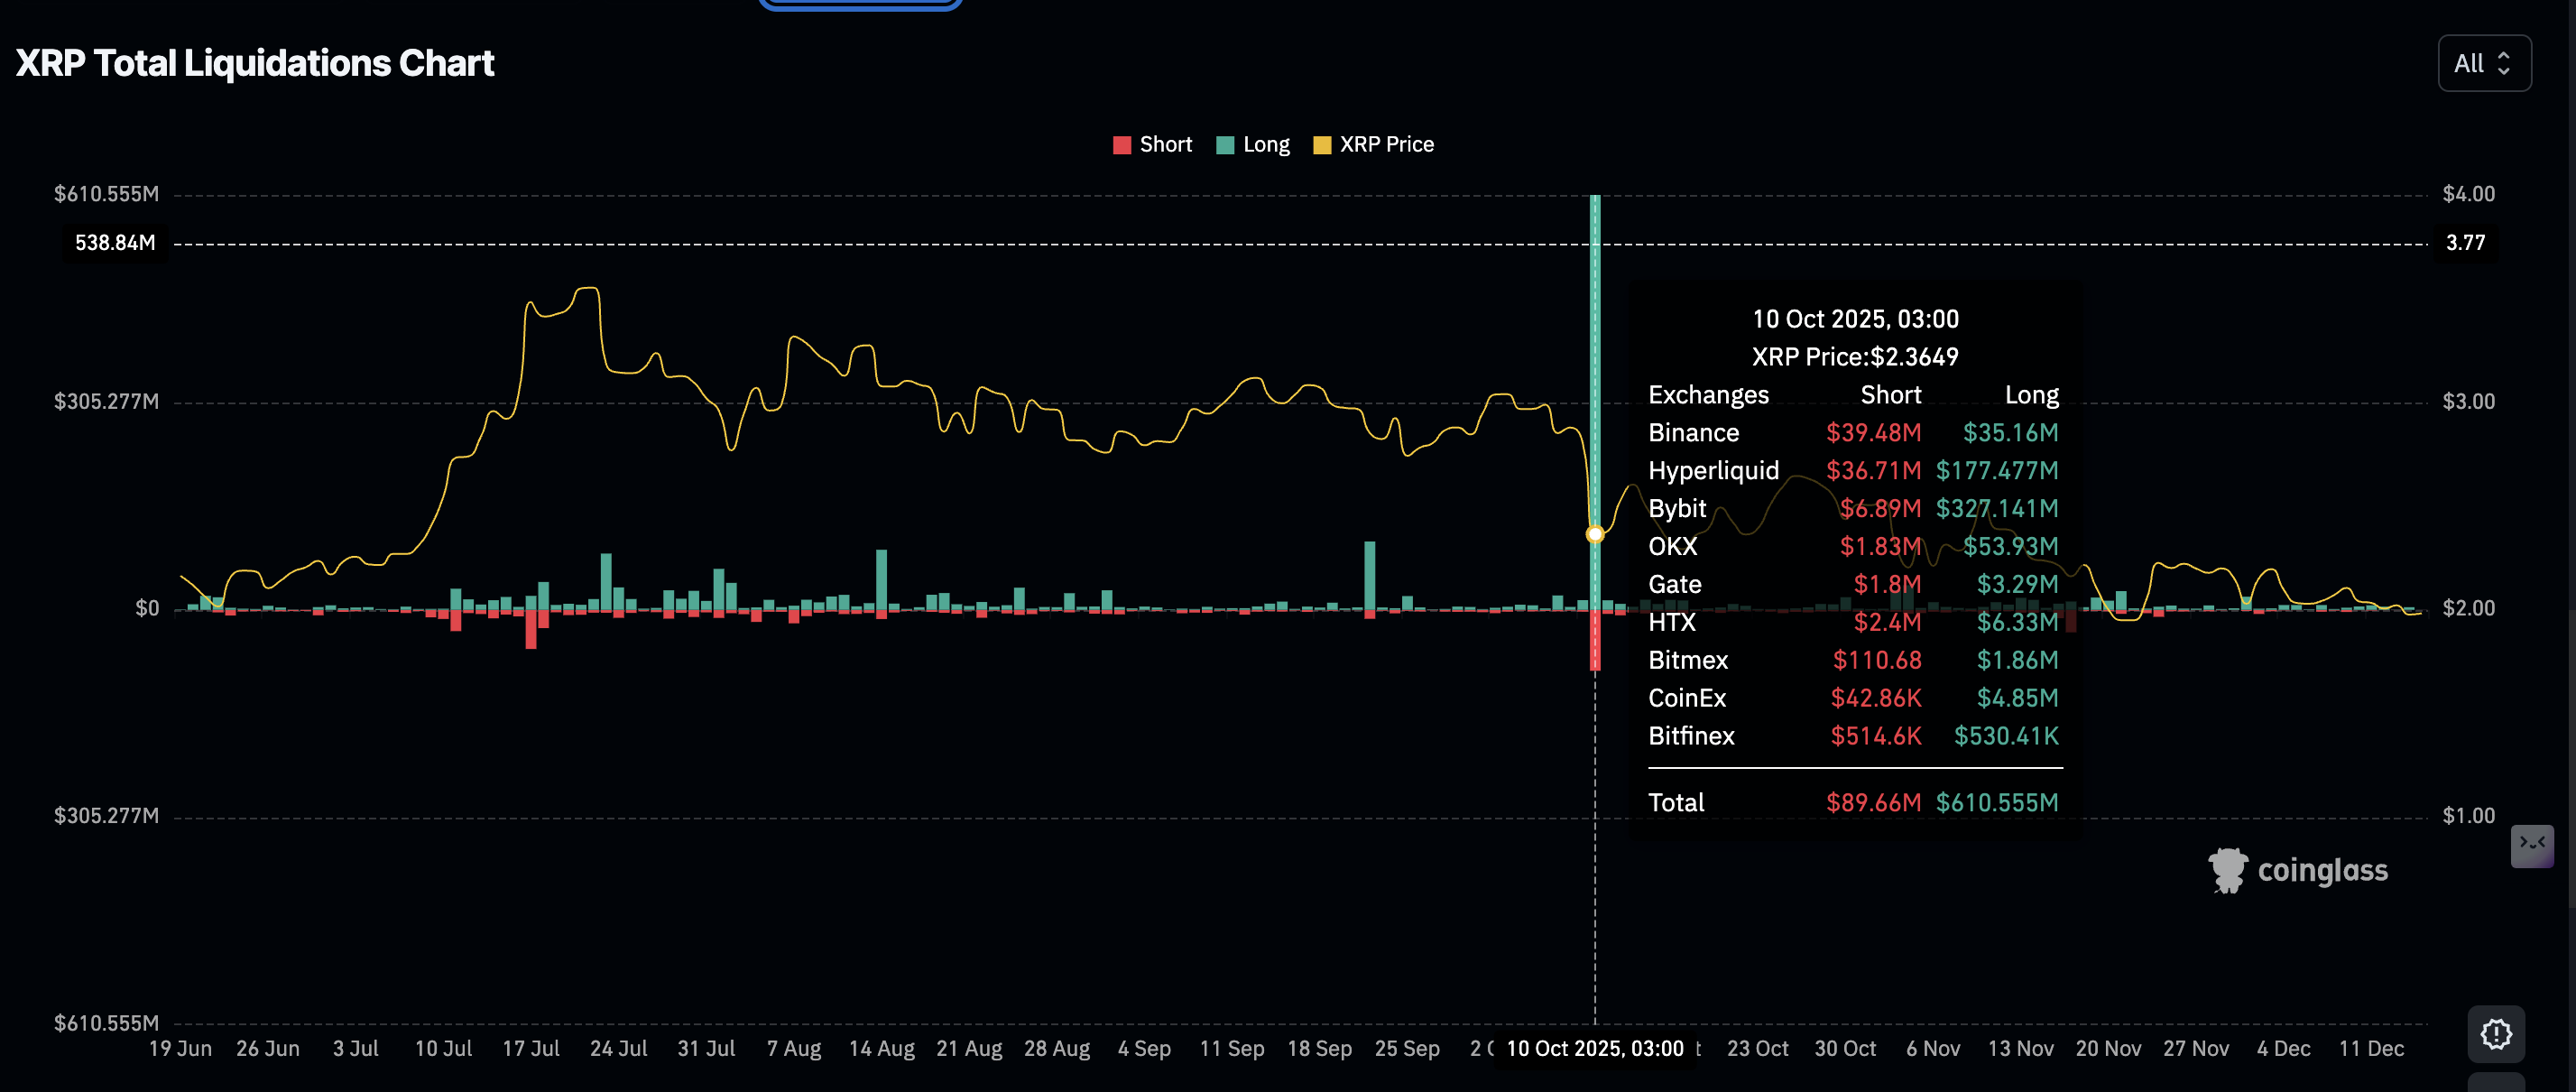
In comparison, the OI peaked at $10.94 billion on July 22, after XRP hit a new record high of $3.66 on July 18. Low retail interest is reflected in OI remaining subdued. This suggests that investors have lost faith in XRP’s ability to maintain an uptrend.
A sustained recovery in OI is required to support price advance beyond the $2.00 key level in the short term.
Despite the diminishing retail interest in XRP, spot Exchange Traded Funds (ETFs) listed in the United States (US) have extended their inflow streak to 21 consecutive days, with almost $11 million deposited on Monday.
The cumulative inflow volume has reached $1 billion, boosting net assets to $1.12 billion. This steady uptake of XRP ETFs highlights growing interest in altcoin-based crypto investment products.
Technical outlook: XRP trades amid lingering downside pressure
XRP is trading at $1.91 at the time of writing on Tuesday while holding well below the 50-day Exponential Moving Average (EMA) at $2.19, the 100-day EMA at $2.37 and the 200-day EMA at $2.44, which keep the bearish alignment intact.
The Moving Average Convergence Divergence (MACD) indicator sits marginally below the zero line on the daily chart, suggesting fading momentum. Investors will consider further reducing their exposure if the blue line stays below the red signal line. The red histogram bars are also expanding below the mean line, suggesting that bearish momentum is increasing.
The Relative Strength Index (RSI) at 36.72 is below the midline and consistent with lingering downside pressure. A descending trend line from $3.09 caps price advances, with resistance seen near $2.11. However, a close above this barrier could trigger a corrective bounce above the pivotal $2.00 level.
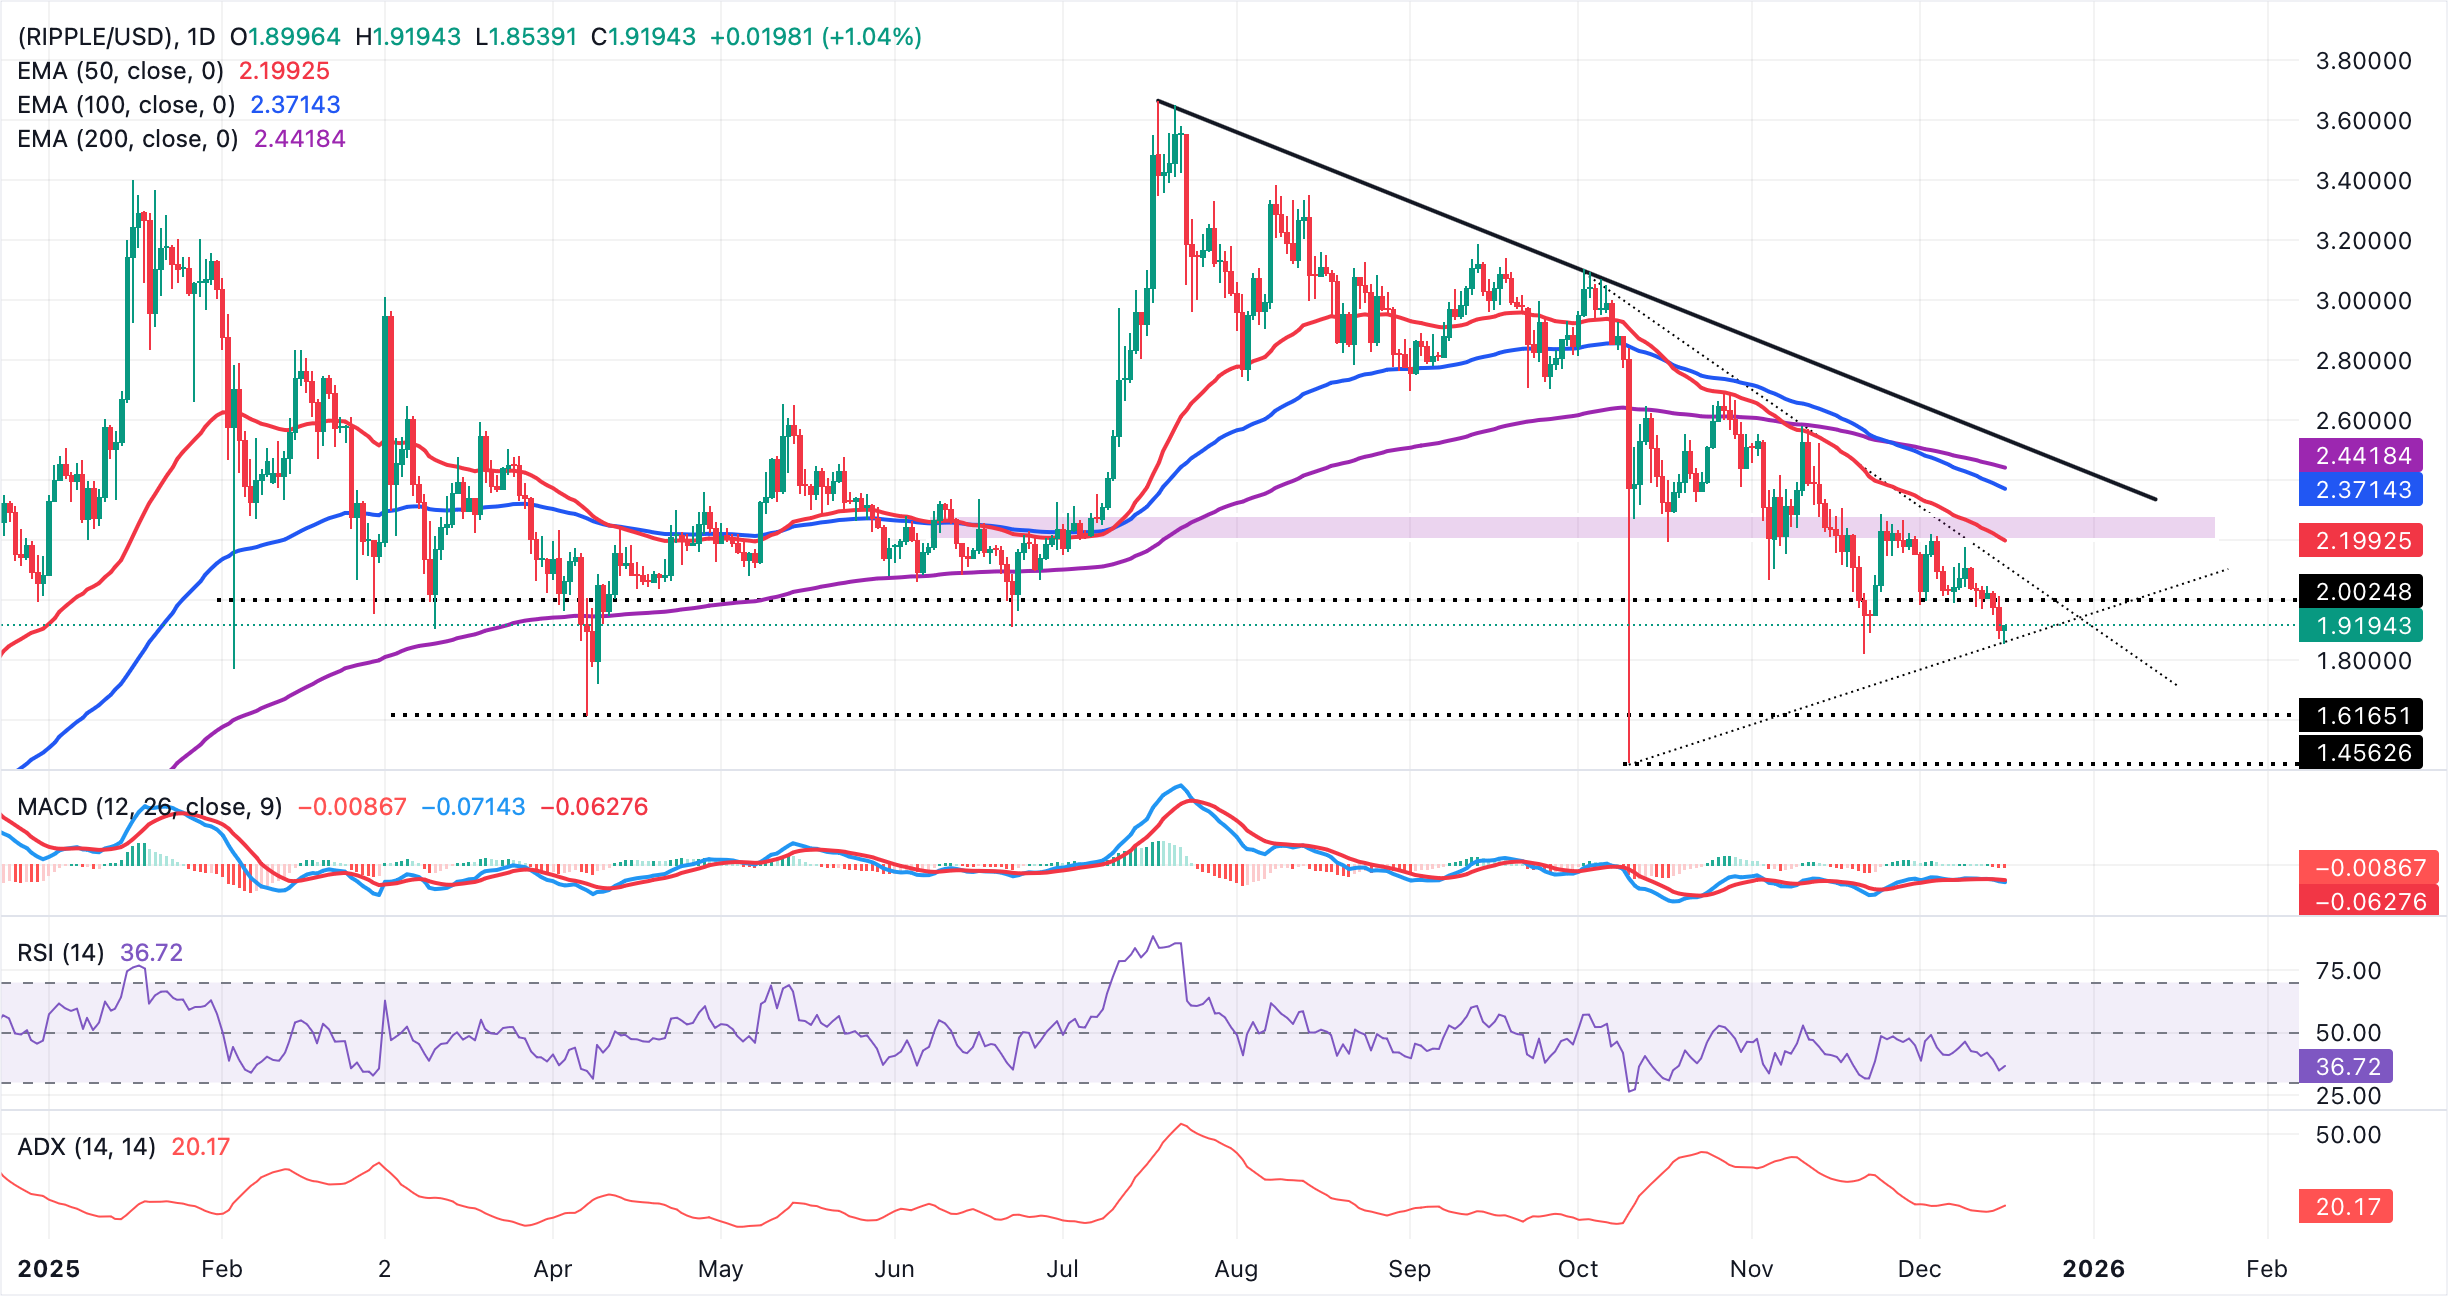
Still, XRP's short- and medium-term EMAs continue to slope lower and sit above spot, which caps rebounds and maintains an overall downward bias. Meanwhile, the rising trend line from $1.45 underpins the broader structure, offering support near $1.86. If XRP breaks below this support level, the price could extend the slide toward April's low of $1.61.
Cryptocurrency metrics FAQs
The developer or creator of each cryptocurrency decides on the total number of tokens that can be minted or issued. Only a certain number of these assets can be minted by mining, staking or other mechanisms. This is defined by the algorithm of the underlying blockchain technology. On the other hand, circulating supply can also be decreased via actions such as burning tokens, or mistakenly sending assets to addresses of other incompatible blockchains.
Market capitalization is the result of multiplying the circulating supply of a certain asset by the asset’s current market value.
Trading volume refers to the total number of tokens for a specific asset that has been transacted or exchanged between buyers and sellers within set trading hours, for example, 24 hours. It is used to gauge market sentiment, this metric combines all volumes on centralized exchanges and decentralized exchanges. Increasing trading volume often denotes the demand for a certain asset as more people are buying and selling the cryptocurrency.
Funding rates are a concept designed to encourage traders to take positions and ensure perpetual contract prices match spot markets. It defines a mechanism by exchanges to ensure that future prices and index prices periodic payments regularly converge. When the funding rate is positive, the price of the perpetual contract is higher than the mark price. This means traders who are bullish and have opened long positions pay traders who are in short positions. On the other hand, a negative funding rate means perpetual prices are below the mark price, and hence traders with short positions pay traders who have opened long positions.
(The technical analysis of this story was written with the help of an AI tool)

超過一百萬用戶依賴 FXStreet 獲取即時市場數據、圖表工具、專家洞見與外匯新聞。其全面的經濟日曆與教育網路研討會協助交易者保持資訊領先、做出審慎決策。FXStreet 擁有約 60 人的團隊,分布於巴塞隆納總部及全球各地。
閱讀更多


