
Ripple Price Forecast: XRP nears lifeline support as macro risks intensify
作者 John Isige
更新: 24 Jun 2026


熱門文章

Ripple (XRP) continues to face significant selling pressure, sliding below $1.10 at the time of writing on Wednesday. This decline mirrors the broader weakness in the crypto market, exacerbated by mounting macroeconomic headwinds and persistent geopolitical uncertainties.
- XRP corrects toward $1.00 psychological support as headwinds intensify in the broader crypto market.
- Macro risks escalate as odds for a September Fed rate hike increase in June amid geopolitical tensions.
- XRP’s upside remains largely constrained by persistent downward pressure from moving averages and subdued interest in derivatives trading.
Ripple (XRP) continues to face significant selling pressure, sliding below $1.10 at the time of writing on Wednesday. This decline mirrors the broader weakness in the crypto market, exacerbated by mounting macroeconomic headwinds and persistent geopolitical uncertainties.
Should the current correction persist, XRP is at risk of revisiting the critical $1.00 support level, a threshold not tested since November 2024.
Fed rate-hike odds tick up amid geopolitical uncertainty
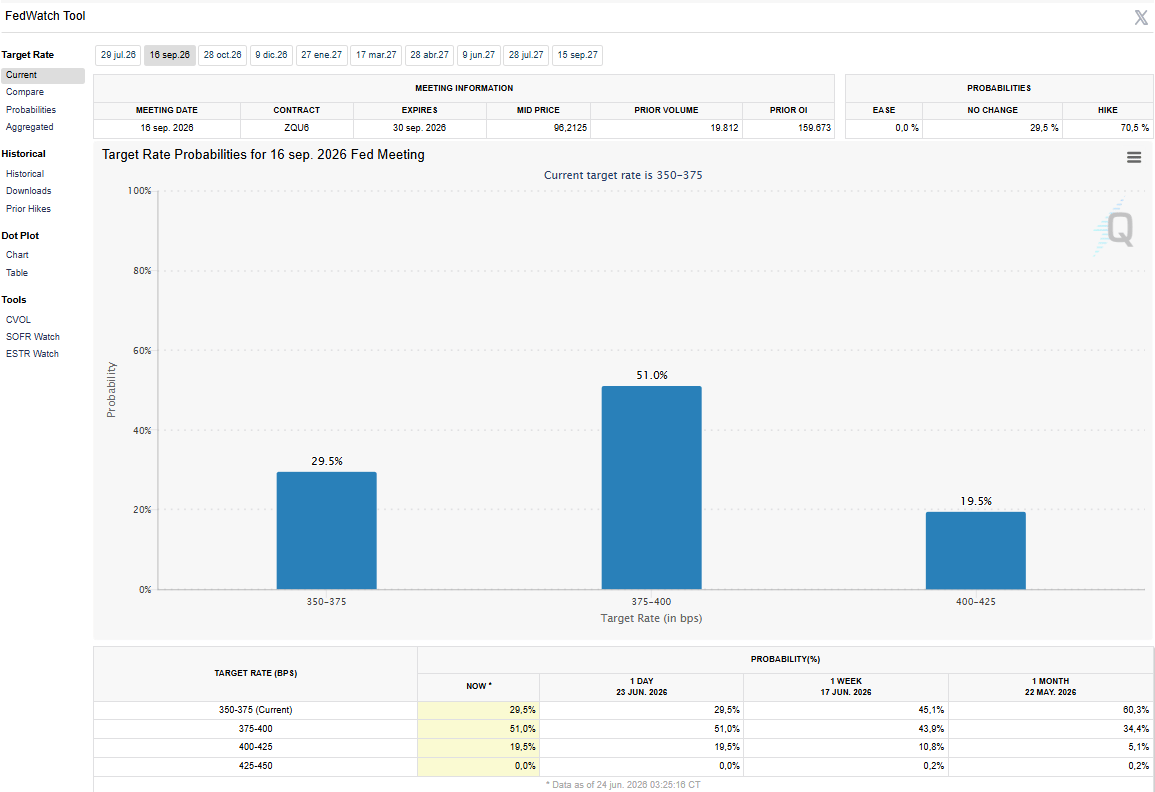
Market participants are pricing in a higher probability that the Federal Reserve (Fed) will raise interest rates at its September review cycle. According to the CME FedWatch tool, the odds of interest rates being higher than current levels in September spiked to 70%, up from 44% one week ago. The probability has moderated to above 50% as of writing.
Headline inflation surged to 4.2% year-over-year in May, according to the latest Consumer Price Index (CPI) data, up from 3.8% in April, a level not seen in more than three years.
At a June 17 post-meeting press conference, Fed Chairman Kevin Warsh reaffirmed the central bank’s commitment to its 2% inflation target and price stability mandate. This increasingly hawkish tone has fueled expectations for a rate hike, which had previously remained subdued throughout the first quarter.
Meanwhile, the United States and Iran remain at odds over the narrative surrounding nuclear talks. President Donald Trump maintains that Iran has consented to the most stringent inspections, while Iranian officials contend that nuclear issues were not addressed in detail during the latest negotiation round.
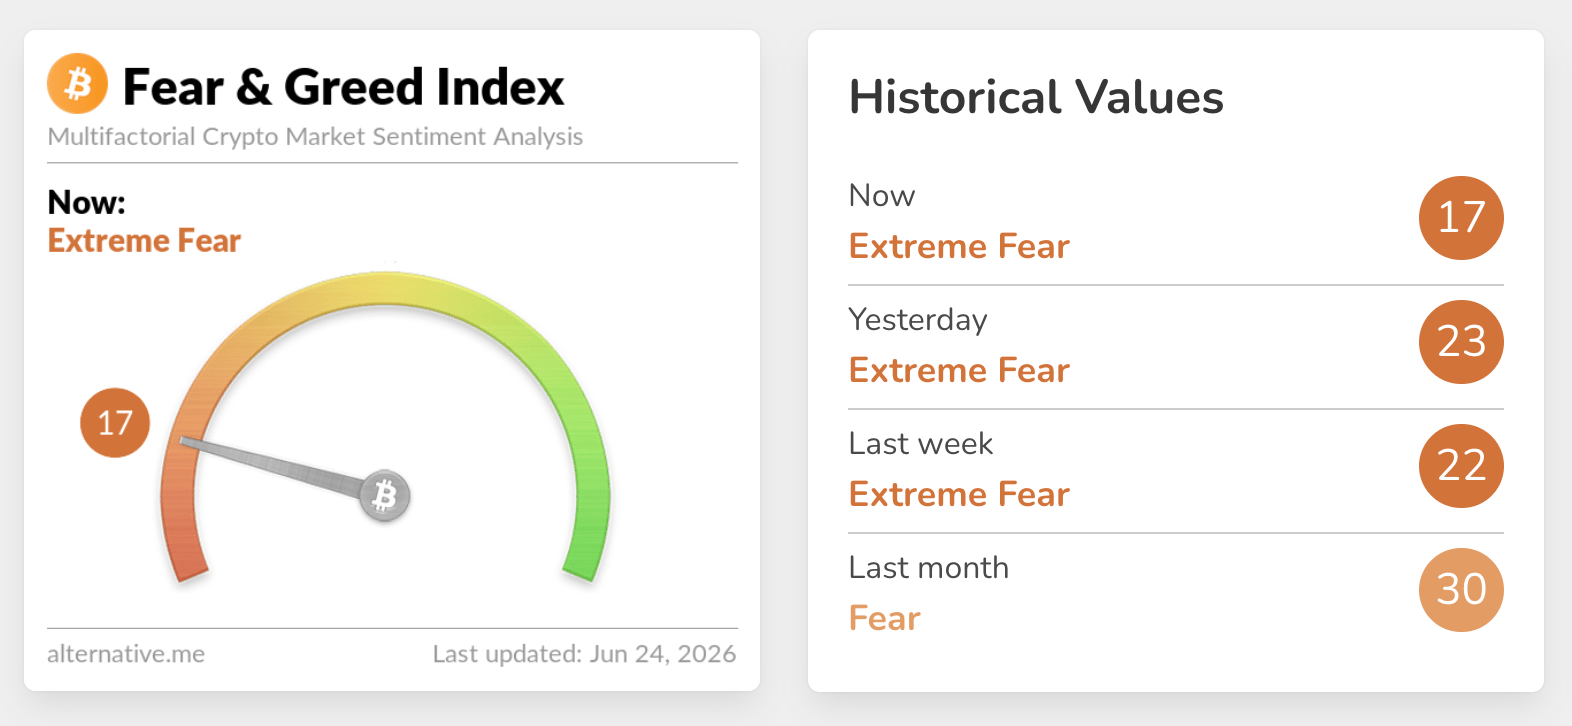
The broader crypto market remains under intense pressure and low risk appetite. According to the Fear & Greed Index, sentiment stands in the Extreme Fear territory at 17 on Wednesday, down from 23 the previous day. This sustained risk-off mood may continue to limit recovery potential.
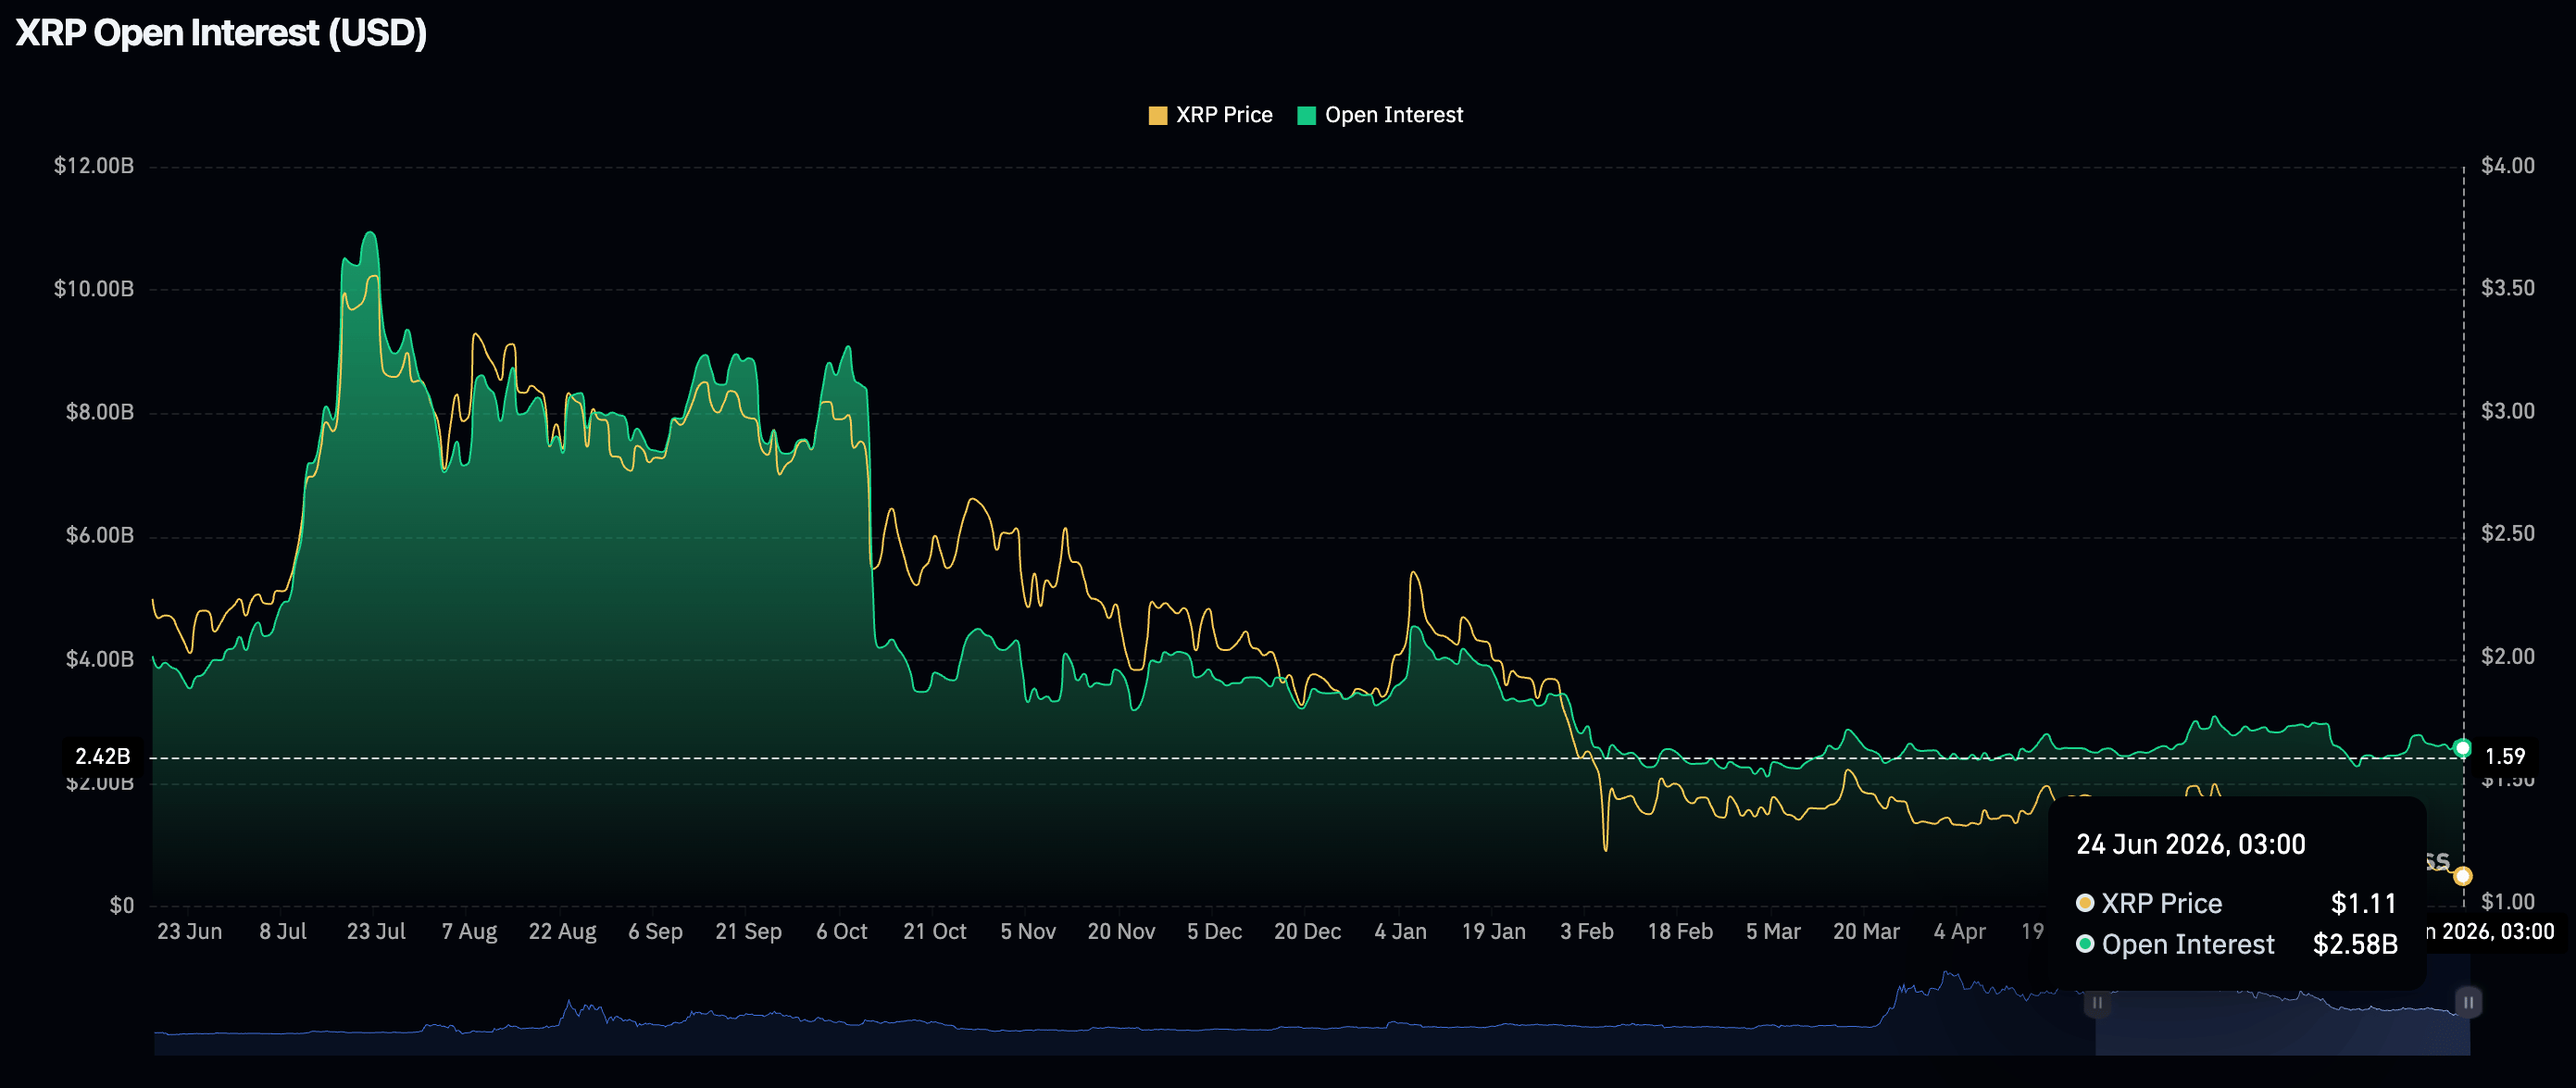
XRP retail demand is suppressed, as reflected in perpetual futures Open Interest (OI) falling to $2.58 billion on Wednesday, from $2.69 billion the day before. The current OI level pales in comparison to the record high of $10.94 billion in July, which coincided with XRP hitting a new all-time high of $3.66. Persistent weakness in the derivatives market means low liquidity and capped tailwinds.
Price analysis: XRP sellers tighten grip toward $1.00 key support
XRP trades at $1.09 keeping a bearish near-term tone as price holds well beneath the 50-day, 100-day and 200-day Exponential Moving Averages (EMAs) at $1.24, $1.34 and $1.55 respectively. The pair is also trading under the Bollinger Bands’ middle line at $1.14, underscoring persistent overhead supply, while the lower band at $1.07 offers the nearest volatility-based floor.
Meanwhile, momentum appears mixed, with the Moving Average Convergence Divergence (MACD) histogram in marginal positive territory on the daily chart, while the Relative Strength Index (RSI) hovering around 35, hints at weak demand rather than a robust recovery.
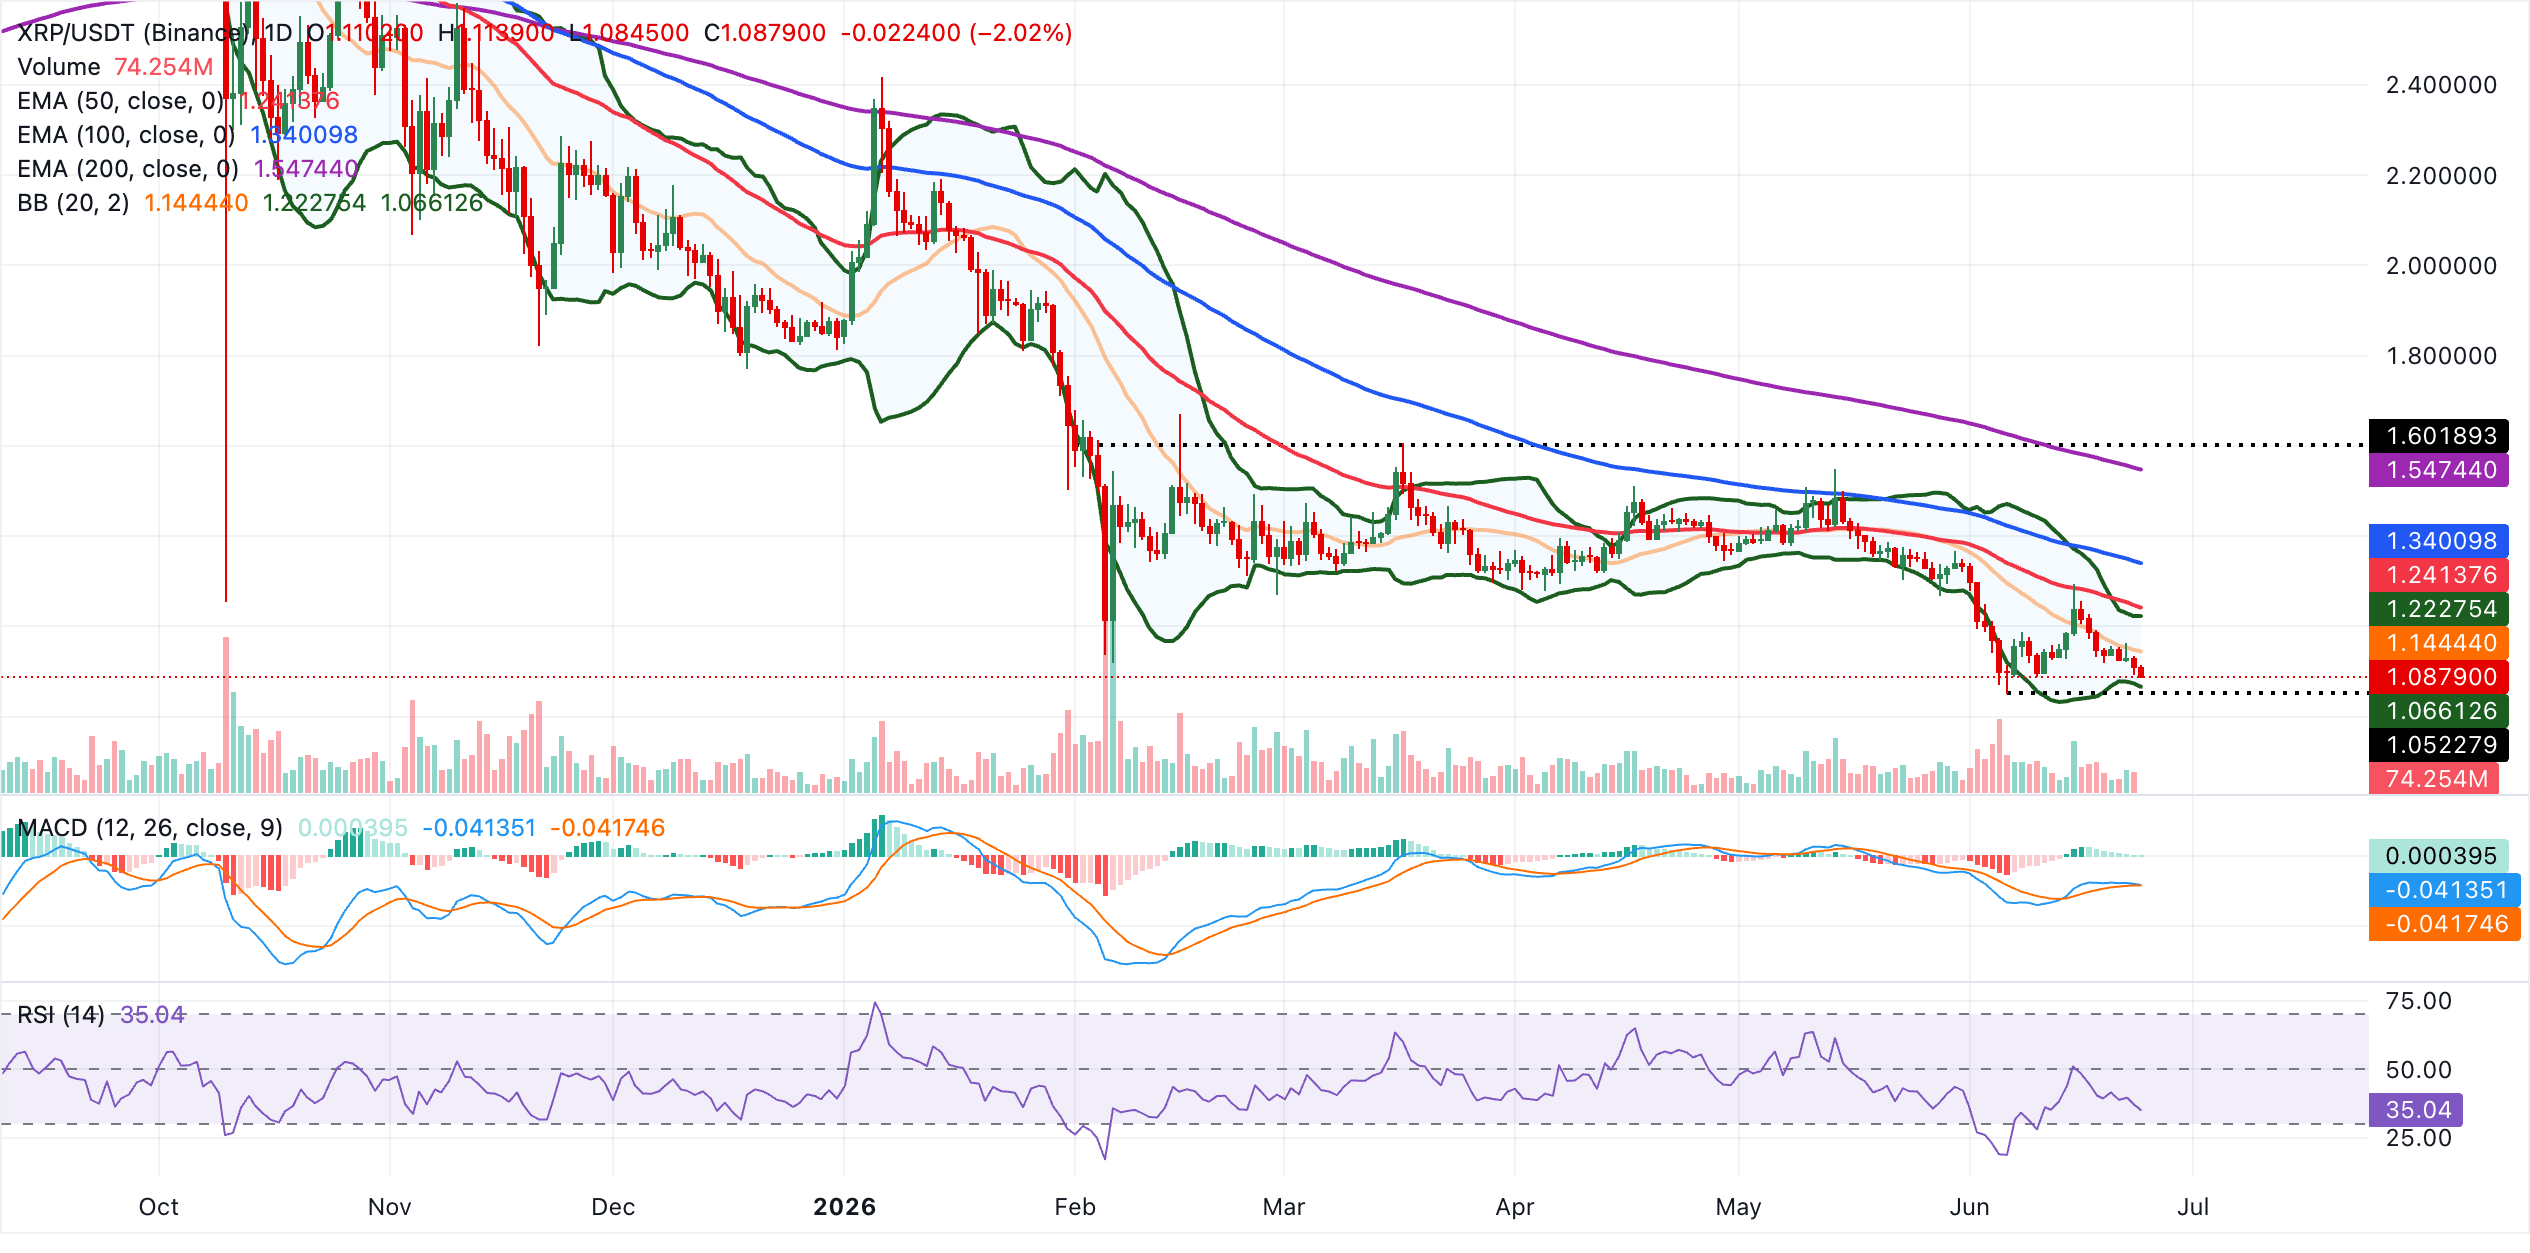
Initial resistance lies at the Bollinger middle band near $1.14, followed by the upper band around $1.22. A sustained break above these would open the door to the 50-day EMA at $1.24, with the 100-day EMA at $1.34 and the 200-day EMA at $1.55 acting as more distant caps.
Conversely, the Bollinger lower band at $1.07 is the first notable support, followed by the recent low around $1.05 and the critical $1.00 psychological demand area. A daily close below this latter level would expose further downside and reinforce the prevailing bearish bias.
(The technical analysis of this story was written with the help of an AI tool.)
Open Interest, funding rate FAQs
Higher Open Interest is associated with higher liquidity and new capital inflow to the market. This is considered the equivalent of increase in efficiency and the ongoing trend continues. When Open Interest decreases, it is considered a sign of liquidation in the market, investors are leaving and the overall demand for an asset is on a decline, fueling a bearish sentiment among investors.
Funding fees bridge the difference between spot prices and prices of futures contracts of an asset by increasing liquidation risks faced by traders. A consistently high and positive funding rate implies there is a bullish sentiment among market participants and there is an expectation of a price hike. A consistently negative funding rate for an asset implies a bearish sentiment, indicating that traders expect the cryptocurrency’s price to fall and a bearish trend reversal is likely to occur.

超過一百萬用戶依賴 FXStreet 獲取即時市場數據、圖表工具、專家洞見與外匯新聞。其全面的經濟日曆與教育網路研討會協助交易者保持資訊領先、做出審慎決策。FXStreet 擁有約 60 人的團隊,分布於巴塞隆納總部及全球各地。
閱讀更多


