
Silver Price Forecast: Gains 2% on US CPI, struggles below $80.00
作者 Christian Borjon Valencia
發布日期: 14 Feb 2026 | 修改日期: 14 Feb 2026


熱門文章

Silver (XAG/USD) price advances on Friday, bouncing off daily lows around $74 and posting gains of over 2.50%, yet it is poised to end the week on a negative note. A softer-than-expected US inflation report pushed the white metal higher, and it trades at $77.20 a troy ounce ahead of the weekend.
- Silver climbs to $77.20 after softer US CPI boosts expectations of Fed easing.
- Technicals point to consolidation, with resistance near the 50-day SMA around $79.00.
- Break below $75.00 exposes $74.01 and $70.00, while reclaiming $80.00 revives bullish momentum.
Silver (XAG/USD) price advances on Friday, bouncing off daily lows around $74 and posting gains of over 2.50%, yet it is poised to end the week on a negative note. A softer-than-expected US inflation report pushed the white metal higher, and it trades at $77.20 a troy ounce ahead of the weekend.
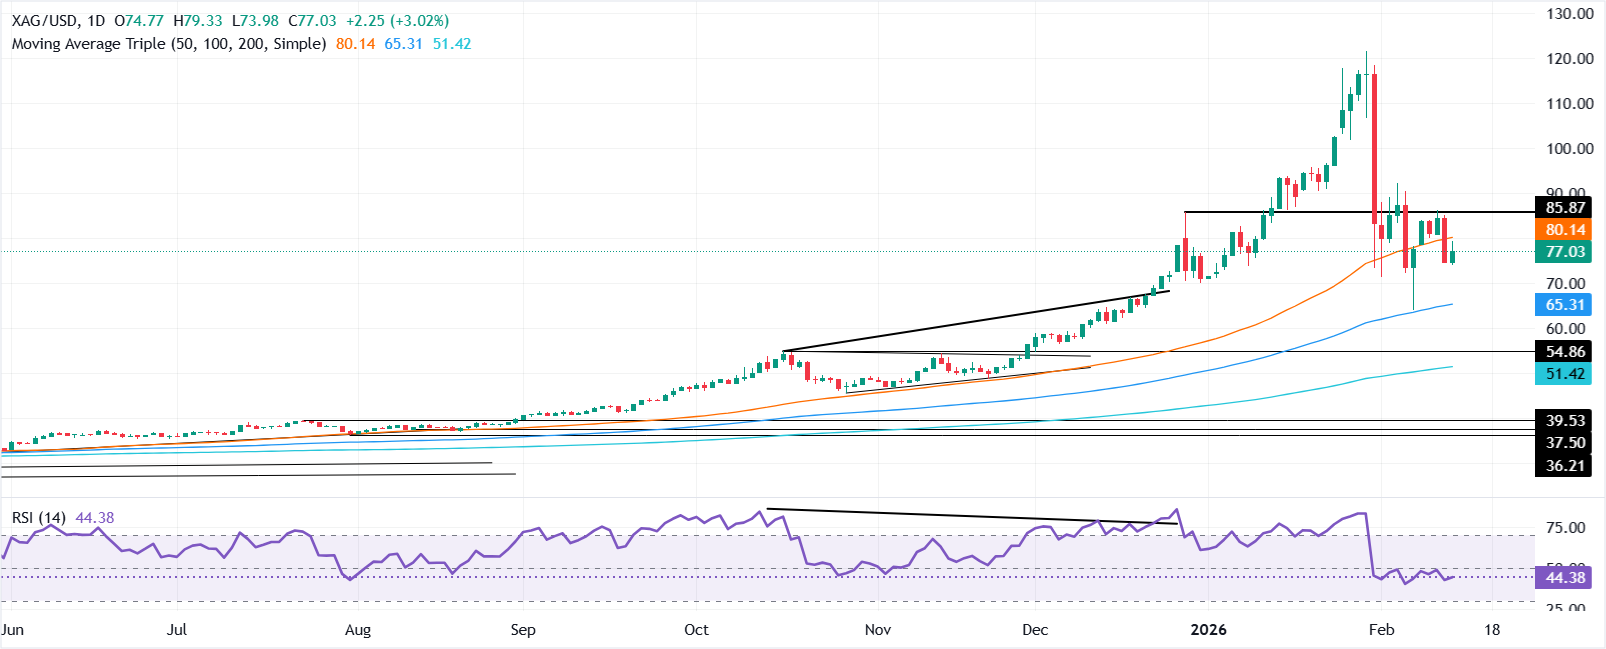
XAG/USD Price Forecast: Technical outlook
Silver is down 0.85% in the week, after beginning the week at around $80.00. Nevertheless, US stocks plunged on Thursday, pushing XAG downward, which has recently moved in sympathy with equities.
The Relative Strength Index (RSI) suggests that the precious metal is poised to trade sideways, capped on the upside by the 50-day SMA at $79.08 and the floor level is seen at $64.41 where the 100-day SMA lies.
If XAG/USD dives below $75.00, the first support would be the February 13 low of $74.01. Once cleared, the next stop would be the $70.00 figure, ahead of the 100-day SMA.
On the upside, if XAG/USD reclaims $80.00, the first resistance would be the December 29 high at $83.75, ahead of the February 11 high at $86.30.
XAG/USD Price Chart – Daily
Silver FAQs
Silver is a precious metal highly traded among investors. It has been historically used as a store of value and a medium of exchange. Although less popular than Gold, traders may turn to Silver to diversify their investment portfolio, for its intrinsic value or as a potential hedge during high-inflation periods. Investors can buy physical Silver, in coins or in bars, or trade it through vehicles such as Exchange Traded Funds, which track its price on international markets.
Silver prices can move due to a wide range of factors. Geopolitical instability or fears of a deep recession can make Silver price escalate due to its safe-haven status, although to a lesser extent than Gold's. As a yieldless asset, Silver tends to rise with lower interest rates. Its moves also depend on how the US Dollar (USD) behaves as the asset is priced in dollars (XAG/USD). A strong Dollar tends to keep the price of Silver at bay, whereas a weaker Dollar is likely to propel prices up. Other factors such as investment demand, mining supply – Silver is much more abundant than Gold – and recycling rates can also affect prices.
Silver is widely used in industry, particularly in sectors such as electronics or solar energy, as it has one of the highest electric conductivity of all metals – more than Copper and Gold. A surge in demand can increase prices, while a decline tends to lower them. Dynamics in the US, Chinese and Indian economies can also contribute to price swings: for the US and particularly China, their big industrial sectors use Silver in various processes; in India, consumers’ demand for the precious metal for jewellery also plays a key role in setting prices.
Silver prices tend to follow Gold's moves. When Gold prices rise, Silver typically follows suit, as their status as safe-haven assets is similar. The Gold/Silver ratio, which shows the number of ounces of Silver needed to equal the value of one ounce of Gold, may help to determine the relative valuation between both metals. Some investors may consider a high ratio as an indicator that Silver is undervalued, or Gold is overvalued. On the contrary, a low ratio might suggest that Gold is undervalued relative to Silver.

超過一百萬用戶依賴 FXStreet 獲取即時市場數據、圖表工具、專家洞見與外匯新聞。其全面的經濟日曆與教育網路研討會協助交易者保持資訊領先、做出審慎決策。FXStreet 擁有約 60 人的團隊,分布於巴塞隆納總部及全球各地。
閱讀更多


