
Silver Price Forecast: RSI recovers above 50, upside bias builds
作者 Vishal Chaturvedi
發布日期: 24 Feb 2026 | 修改日期: 24 Feb 2026


熱門文章

Silver (XAG/USD) regains traction on Tuesday after earlier intraday weakness, as lingering geopolitical and economic risks keep dip buyers active.
- Silver rebounds from intraday lows as dip buyers step back in, though a firmer US Dollar limits further gains.
- Technically, XAG/USD maintains a mildly bullish bias after reclaiming the 50-day SMA.
- A sustained move above $92.75 would confirm bullish continuation, while $85.93 remains key support on the downside.
Silver (XAG/USD) regains traction on Tuesday after earlier intraday weakness, as lingering geopolitical and economic risks keep dip buyers active.
At the time of writing, XAG/USD trades near $87.80, rebounding sharply from the daily low of $84.96. However, a firmer US Dollar (USD) is capping further upside attempts.
The white metal has surged nearly 23% over the last four trading days, reaching its highest level in almost three weeks on Monday. The rebound suggests bulls are gradually regaining control following the sharp corrective pullback from the late-January record high near $121.66.
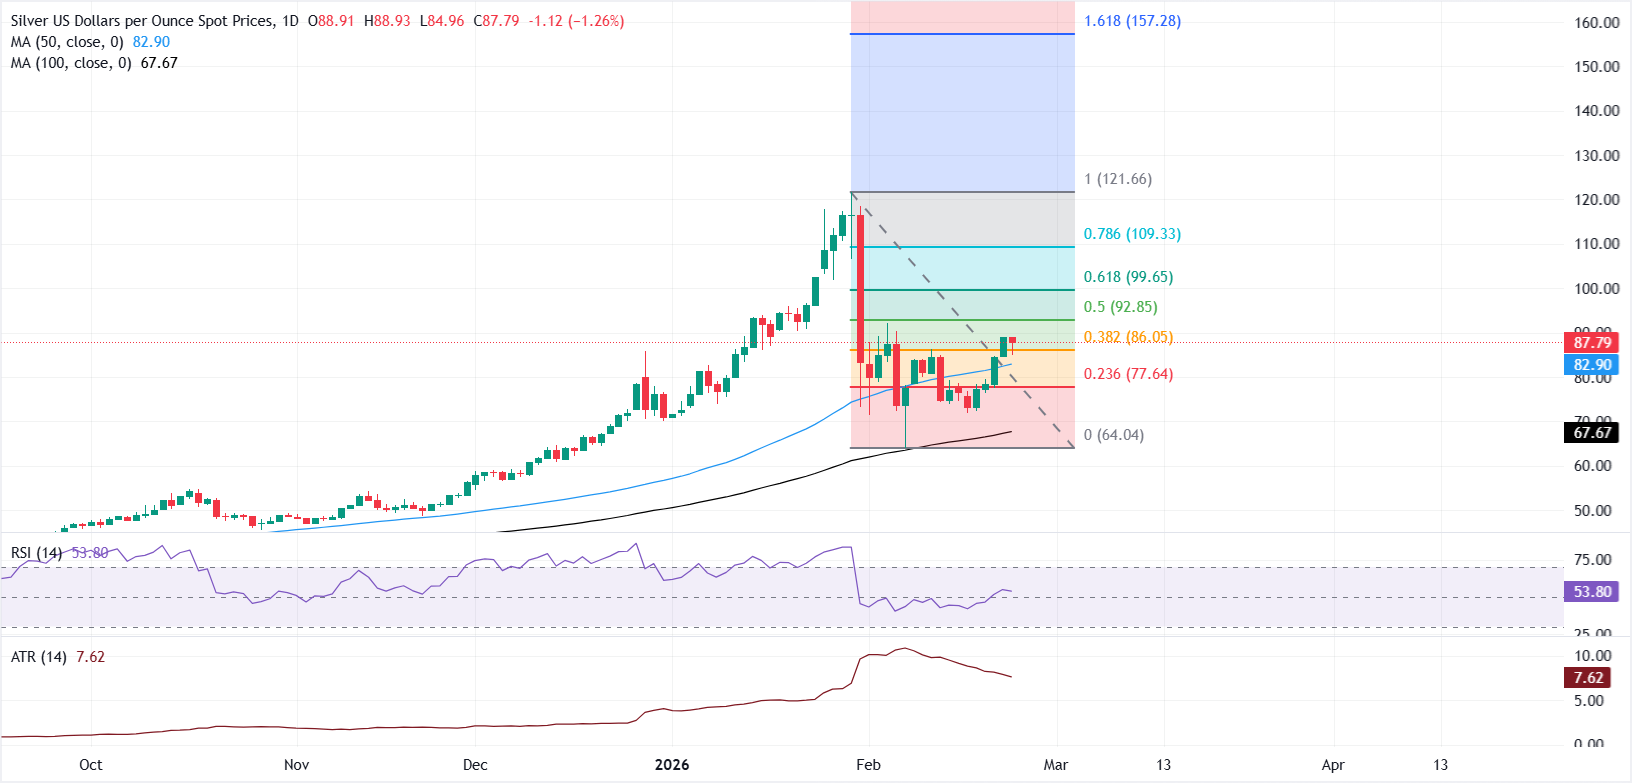
From a technical perspective, the daily chart shows a mildly bullish near-term bias. Price has reclaimed the rising 50-day Simple Moving Average (SMA) and remains comfortably above the 100-day SMA, which are clustered in the low-to-mid $80s and continue to reinforce the broader underlying uptrend.
The Relative Strength Index (RSI) has stabilized just above the 50 mark after recovering from mid-range levels, signaling improving momentum without yet entering overbought territory.
Meanwhile, the Average True Range (ATR) has eased from recent peaks, suggesting that the extreme volatility phase is fading and price action may transition into a steadier directional move rather than sharp swings.
On the downside, initial support emerges near the 38.2% Fibonacci retracement at $86.05, measured from the $64.08 low to the $121.66 high. A sustained break below this level could expose the 23.6% retracement at $77.64 as the next meaningful support zone.
On the upside, immediate resistance aligns with the 50% Fibonacci retracement at $92.85. A decisive close above this barrier would strengthen bullish conviction and open the door toward the 61.8% retracement at $99.65.
(The technical analysis of this story was written with the help of an AI tool.)
Silver FAQs
Silver is a precious metal highly traded among investors. It has been historically used as a store of value and a medium of exchange. Although less popular than Gold, traders may turn to Silver to diversify their investment portfolio, for its intrinsic value or as a potential hedge during high-inflation periods. Investors can buy physical Silver, in coins or in bars, or trade it through vehicles such as Exchange Traded Funds, which track its price on international markets.
Silver prices can move due to a wide range of factors. Geopolitical instability or fears of a deep recession can make Silver price escalate due to its safe-haven status, although to a lesser extent than Gold's. As a yieldless asset, Silver tends to rise with lower interest rates. Its moves also depend on how the US Dollar (USD) behaves as the asset is priced in dollars (XAG/USD). A strong Dollar tends to keep the price of Silver at bay, whereas a weaker Dollar is likely to propel prices up. Other factors such as investment demand, mining supply – Silver is much more abundant than Gold – and recycling rates can also affect prices.
Silver is widely used in industry, particularly in sectors such as electronics or solar energy, as it has one of the highest electric conductivity of all metals – more than Copper and Gold. A surge in demand can increase prices, while a decline tends to lower them. Dynamics in the US, Chinese and Indian economies can also contribute to price swings: for the US and particularly China, their big industrial sectors use Silver in various processes; in India, consumers’ demand for the precious metal for jewellery also plays a key role in setting prices.
Silver prices tend to follow Gold's moves. When Gold prices rise, Silver typically follows suit, as their status as safe-haven assets is similar. The Gold/Silver ratio, which shows the number of ounces of Silver needed to equal the value of one ounce of Gold, may help to determine the relative valuation between both metals. Some investors may consider a high ratio as an indicator that Silver is undervalued, or Gold is overvalued. On the contrary, a low ratio might suggest that Gold is undervalued relative to Silver.

超過一百萬用戶依賴 FXStreet 獲取即時市場數據、圖表工具、專家洞見與外匯新聞。其全面的經濟日曆與教育網路研討會協助交易者保持資訊領先、做出審慎決策。FXStreet 擁有約 60 人的團隊,分布於巴塞隆納總部及全球各地。
閱讀更多


