
Silver Price Forecast: XAG/USD trades above $70.00, nine-day EMA, wedge confluence
作者 Akhtar Faruqui
更新: 15 Jun 2026


熱門文章
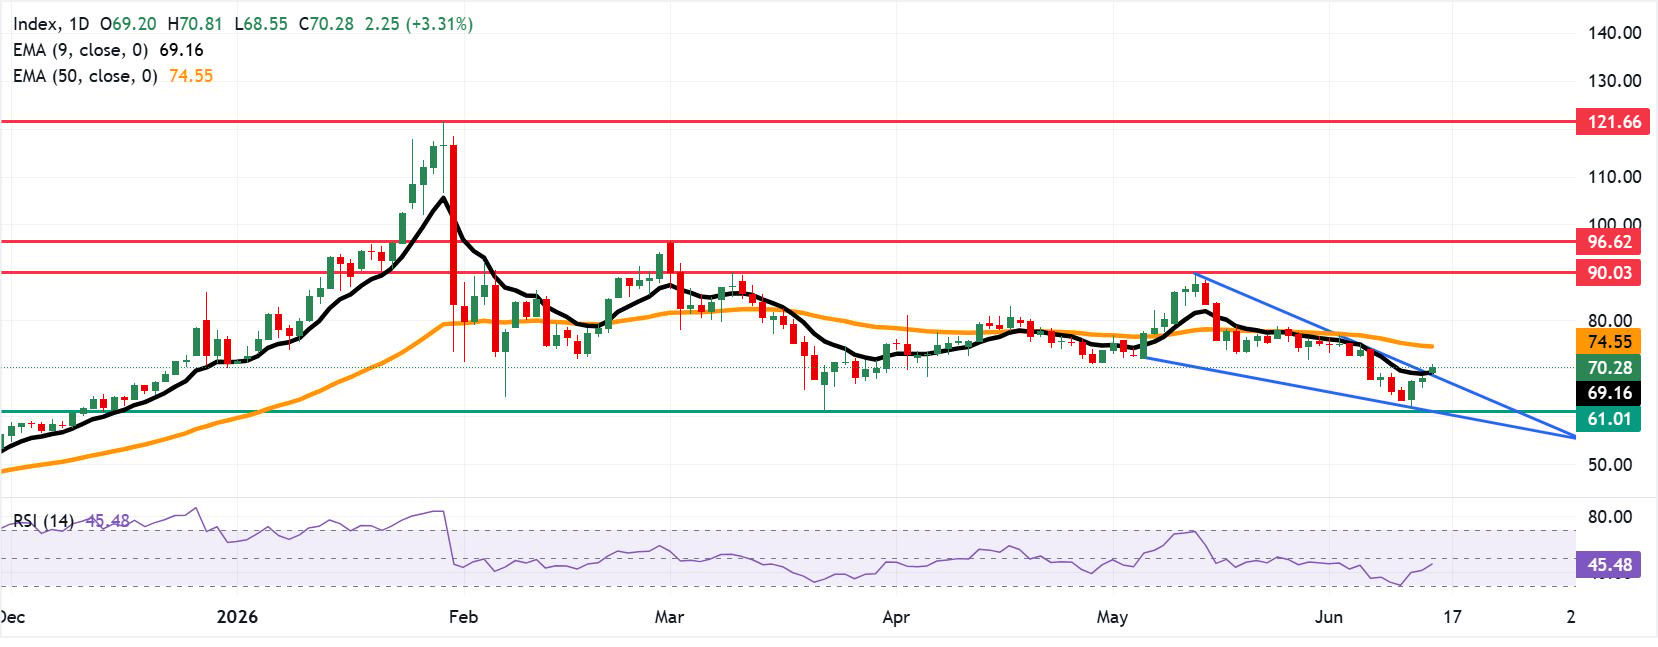
XAG/USD extends its gains for the third consecutive day, trading around $70.30 per troy ounce during the Asian hours on Monday. The technical analysis of the daily chart shows that the spot price is breaking above the falling wedge pattern, suggesting a potential bullish reversal.
- Silver price may rise toward the 50-day EMA at $74.55.
- The 14-day Relative Strength Index at 45.05 sits below the midline, indicating subdued upside momentum.
- XAG/USD may find immediate support at the nine-day EMA of $69.16.
XAG/USD extends its gains for the third consecutive day, trading around $70.30 per troy ounce during the Asian hours on Monday. The technical analysis of the daily chart shows that the spot price is breaking above the falling wedge pattern, suggesting a potential bullish reversal.
The XAG/USD pair is keeping a bearish near-term tone as it holds below the 50-day Exponential Moving Average (EMA) while clinging to initial support from the nine-day EMA. The 14-day Relative Strength Index (RSI) at 45.05 sits below the midline, hinting at subdued upside momentum and suggesting that rebounds may struggle while price remains capped under the medium-term EMA.
However, the Silver price may find its initial barrier at the 50-day EMA of $74.55. A break above the medium-term average would strengthen the bullish bias and support the XAG/USD pair to explore the area around the three-month high of $90.03, reached on March 10.
On the downside, the immediate support lies at the nine-day EMA of $69.16. A pullback within the falling wedge would put downward pressure on the Silver price to navigate the region around the lower boundary at $61.80, followed by the six-month low of $61.01, recorded on March 23.
(The technical analysis of this story was written with the help of an AI tool.)
Silver FAQs
Silver is a precious metal highly traded among investors. It has been historically used as a store of value and a medium of exchange. Although less popular than Gold, traders may turn to Silver to diversify their investment portfolio, for its intrinsic value or as a potential hedge during high-inflation periods. Investors can buy physical Silver, in coins or in bars, or trade it through vehicles such as Exchange Traded Funds, which track its price on international markets.
Silver prices can move due to a wide range of factors. Geopolitical instability or fears of a deep recession can make Silver price escalate due to its safe-haven status, although to a lesser extent than Gold's. As a yieldless asset, Silver tends to rise with lower interest rates. Its moves also depend on how the US Dollar (USD) behaves as the asset is priced in dollars (XAG/USD). A strong Dollar tends to keep the price of Silver at bay, whereas a weaker Dollar is likely to propel prices up. Other factors such as investment demand, mining supply – Silver is much more abundant than Gold – and recycling rates can also affect prices.
Silver is widely used in industry, particularly in sectors such as electronics or solar energy, as it has one of the highest electric conductivity of all metals – more than Copper and Gold. A surge in demand can increase prices, while a decline tends to lower them. Dynamics in the US, Chinese and Indian economies can also contribute to price swings: for the US and particularly China, their big industrial sectors use Silver in various processes; in India, consumers’ demand for the precious metal for jewellery also plays a key role in setting prices.
Silver prices tend to follow Gold's moves. When Gold prices rise, Silver typically follows suit, as their status as safe-haven assets is similar. The Gold/Silver ratio, which shows the number of ounces of Silver needed to equal the value of one ounce of Gold, may help to determine the relative valuation between both metals. Some investors may consider a high ratio as an indicator that Silver is undervalued, or Gold is overvalued. On the contrary, a low ratio might suggest that Gold is undervalued relative to Silver.

超過一百萬用戶依賴 FXStreet 獲取即時市場數據、圖表工具、專家洞見與外匯新聞。其全面的經濟日曆與教育網路研討會協助交易者保持資訊領先、做出審慎決策。FXStreet 擁有約 60 人的團隊,分布於巴塞隆納總部及全球各地。
閱讀更多


