
Silver Price Forecast: XAG/USD trades almost flat above $72 as Trump’s Iran deadline is in focus
作者 Sagar Dua
更新: 7 Apr 2026


熱門文章

Silver price (XAG/USD) trades broadly flat around $72.50 during the early European trading session on Tuesday. The white metal struggles for a direction as investors await Iran’s final decision over the reopening of the Strait of Hormuz.
- Silver price consolidates around $72.50 in the countdown to Trump’s Iran deadline.
- Iran has stated that it won’t reopen the Hormuz in return for a temporary ceasefire.
- Investors await the US FOMC minutes and the CPI data.
Silver price (XAG/USD) trades broadly flat around $72.50 during the early European trading session on Tuesday. The white metal struggles for a direction as investors await Iran’s final decision over the reopening of the Strait of Hormuz.
Over the weekend, United States (US) President Donald Trump warned through a post on Truth.Social that he will destroy Iranian power plants and bridges if it doesn't reopen the Hormuz by Tuesday, 08:00 ET.
Ahead of US President Trump’s ultimatum, Iranian officials have stated that they won’t open the Hormuz in exchange for a temporary ceasefire.
Theoretically, heightened geopolitical tensions improve demand for safe-haven assets, such as Silver; however, it has been underperforming since the Middle East war started, as rising energy prices due to conflicts have prompted global inflation expectations. This scenario generally discourages central banks from easing monetary conditions, which diminishes demand for non-yielding assets, such as Silver.
Meanwhile, investors await the US Federal Open Market Committee (FOMC) minutes of the March policy meeting, which will be released on Wednesday. In the meeting, the Fed kept interest rates steady in the range of 3.50%-3.75%, and stated that the current policy stance is appropriate. In the press conference, Fed Chair Jerome Powell warned that “higher energy prices will push up inflation in the near term”.
To understand the current inflation situation, investors will focus on the Consumer Price Index (CPI) data for March, which will be released on Friday.
Silver technical analysis
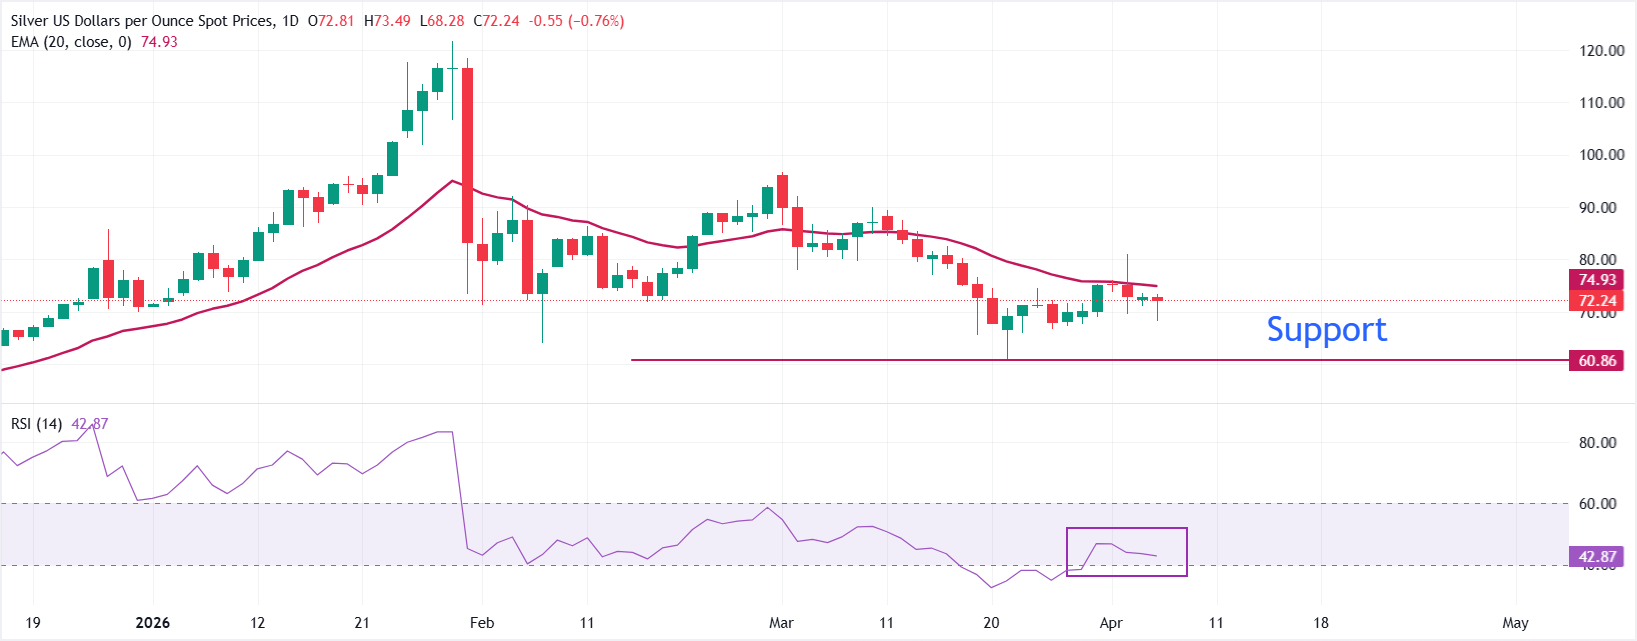
XAG/USD trades almost flat at around $72.50 at the press time. The pair holds a bearish near-term bias as price extends its decline below the 20-day Exponential Moving Average (EMA), which has turned lower and now tracks well above the market, reinforcing downside pressure.
The 14-day Relative Strength Index (RSI) sits near 43 and trends below the 50 line, confirming persistent negative momentum rather than a capitulatory oversold stretch.
Initial resistance emerges at the descending 20-day EMA at $75.00, and a break above this area would be needed to ease immediate selling pressure. Beyond that, the next resistance stands at the April 2 high at $81.13. On the downside, immediate support aligns near $70.00, and a sustained break below this floor would open the path toward the next support zone around the March 26 low of $66.71.
(The technical analysis of this story was written with the help of an AI tool.)
Silver FAQs
Silver is a precious metal highly traded among investors. It has been historically used as a store of value and a medium of exchange. Although less popular than Gold, traders may turn to Silver to diversify their investment portfolio, for its intrinsic value or as a potential hedge during high-inflation periods. Investors can buy physical Silver, in coins or in bars, or trade it through vehicles such as Exchange Traded Funds, which track its price on international markets.
Silver prices can move due to a wide range of factors. Geopolitical instability or fears of a deep recession can make Silver price escalate due to its safe-haven status, although to a lesser extent than Gold's. As a yieldless asset, Silver tends to rise with lower interest rates. Its moves also depend on how the US Dollar (USD) behaves as the asset is priced in dollars (XAG/USD). A strong Dollar tends to keep the price of Silver at bay, whereas a weaker Dollar is likely to propel prices up. Other factors such as investment demand, mining supply – Silver is much more abundant than Gold – and recycling rates can also affect prices.
Silver is widely used in industry, particularly in sectors such as electronics or solar energy, as it has one of the highest electric conductivity of all metals – more than Copper and Gold. A surge in demand can increase prices, while a decline tends to lower them. Dynamics in the US, Chinese and Indian economies can also contribute to price swings: for the US and particularly China, their big industrial sectors use Silver in various processes; in India, consumers’ demand for the precious metal for jewellery also plays a key role in setting prices.
Silver prices tend to follow Gold's moves. When Gold prices rise, Silver typically follows suit, as their status as safe-haven assets is similar. The Gold/Silver ratio, which shows the number of ounces of Silver needed to equal the value of one ounce of Gold, may help to determine the relative valuation between both metals. Some investors may consider a high ratio as an indicator that Silver is undervalued, or Gold is overvalued. On the contrary, a low ratio might suggest that Gold is undervalued relative to Silver.

超過一百萬用戶依賴 FXStreet 獲取即時市場數據、圖表工具、專家洞見與外匯新聞。其全面的經濟日曆與教育網路研討會協助交易者保持資訊領先、做出審慎決策。FXStreet 擁有約 60 人的團隊,分布於巴塞隆納總部及全球各地。
閱讀更多


