
Silver Price Forecasts: XAG/USD drifts below $72 with all eyes on Iran’s war
作者 Guillermo Alcala
更新: 7 Apr 2026


熱門文章

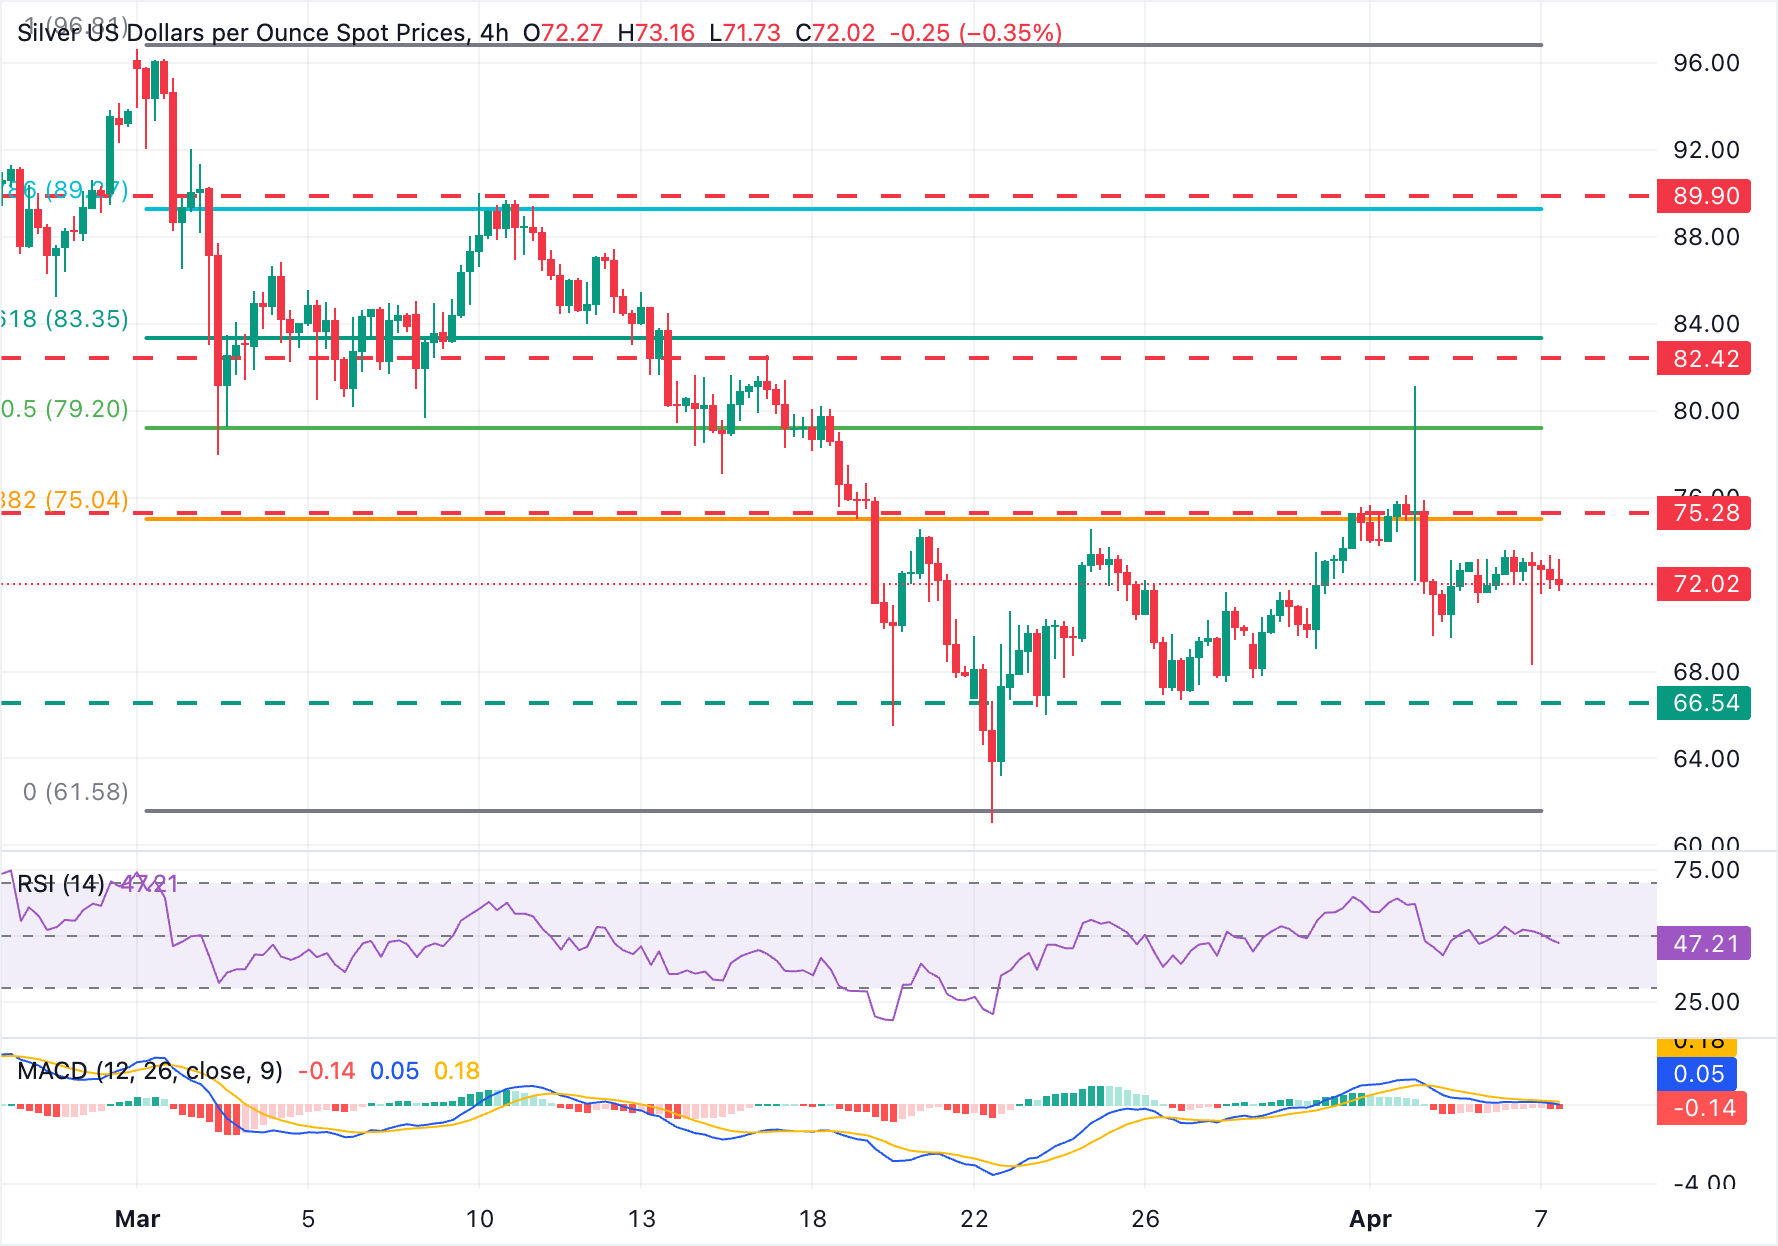
Silver (XAG/USD) is showing a mild bearish momentum on Tuesday’s European trading session, with the reversal from Monday's high, at 81.13, extending to levels below $72.00, amid vanishing hopes of a peace deal in Iran.
- Silver extends its reversal from Monday's highs above $81.00 to levels below $72.00.
- Precious metals remain on the defensive with Trump's deadline on Iran looming.
- XAG/USD shows a moderate bearish pressure halfway through the last two weeks' trading range.
Silver (XAG/USD) is showing a mild bearish momentum on Tuesday’s European trading session, with the reversal from Monday's high, at 81.13, extending to levels below $72.00, amid vanishing hopes of a peace deal in Iran. The US Dollar remains steady as the ultimatum on Iran to reopen the Strait of Hormuz expires in a few hours.
The US and Iran rejected the peace plan submitted by Pakistan on Monday, while Iran's alternative proposal was considered “significant” but not enough by US President Donald Trump. The deadline for Iran to reopen the critical waterway expires on Tuesday at 8 PM, and Trump has threatened to “demolish” the country in one night unless a last-minute breakthrough is reached.
Technical Analysis
XAG/USD shows a mildly bearish near-term bias after failing to sustain recent highs. The 4-hour Relative Strength Index (RSI) has pulled back below the 50 line, suggesting fading upside pressure. The Moving Average Convergence Divergence (MACD) indicator holds in negative territory with a slightly negative histogram, reinforcing waning bullish momentum.
On the downside, Monday's low, at the $68.30 area, might provide support ahead of the March 26 low, near $66.70. Further down, the 2026 low, at the $61.400 area, will come into the bears' focus
To the upside, the 38.6% Fionacci retracement of the late March sell-off, at the $75.00 area, keeps holding bulls. Further up, the pair might find sellers at the area between the March 17 high, at the $82.55 area, and the 61.8% Fibonacci retracement of the aforementioned cycle, at $83.35.
(The technical analysis of this story was written with the help of an AI tool.)
Silver FAQs
Silver is a precious metal highly traded among investors. It has been historically used as a store of value and a medium of exchange. Although less popular than Gold, traders may turn to Silver to diversify their investment portfolio, for its intrinsic value or as a potential hedge during high-inflation periods. Investors can buy physical Silver, in coins or in bars, or trade it through vehicles such as Exchange Traded Funds, which track its price on international markets.
Silver prices can move due to a wide range of factors. Geopolitical instability or fears of a deep recession can make Silver price escalate due to its safe-haven status, although to a lesser extent than Gold's. As a yieldless asset, Silver tends to rise with lower interest rates. Its moves also depend on how the US Dollar (USD) behaves as the asset is priced in dollars (XAG/USD). A strong Dollar tends to keep the price of Silver at bay, whereas a weaker Dollar is likely to propel prices up. Other factors such as investment demand, mining supply – Silver is much more abundant than Gold – and recycling rates can also affect prices.
Silver is widely used in industry, particularly in sectors such as electronics or solar energy, as it has one of the highest electric conductivity of all metals – more than Copper and Gold. A surge in demand can increase prices, while a decline tends to lower them. Dynamics in the US, Chinese and Indian economies can also contribute to price swings: for the US and particularly China, their big industrial sectors use Silver in various processes; in India, consumers’ demand for the precious metal for jewellery also plays a key role in setting prices.
Silver prices tend to follow Gold's moves. When Gold prices rise, Silver typically follows suit, as their status as safe-haven assets is similar. The Gold/Silver ratio, which shows the number of ounces of Silver needed to equal the value of one ounce of Gold, may help to determine the relative valuation between both metals. Some investors may consider a high ratio as an indicator that Silver is undervalued, or Gold is overvalued. On the contrary, a low ratio might suggest that Gold is undervalued relative to Silver.

超過一百萬用戶依賴 FXStreet 獲取即時市場數據、圖表工具、專家洞見與外匯新聞。其全面的經濟日曆與教育網路研討會協助交易者保持資訊領先、做出審慎決策。FXStreet 擁有約 60 人的團隊,分布於巴塞隆納總部及全球各地。
閱讀更多


