
Solana Price Analysis: SOL declines as bearish momentum targets sub-$80 support
- Solana extends losses below $85 on Monday amid growing selling pressure.
- Institutional demand for SOL holds steady as retail confidence falters in the short-term.
- The technical outlook for Solana is bearish, targeting support at sub-$80 levels.
Solana (SOL) hovers below $85 at press time on Monday, trading in the red for the fourth consecutive day. SOL derivatives lose retail participation as the broader cryptocurrency market declines, even as steady inflows into SOL-focused Exchange Traded Funds (ETFs) occurred last week. The path of least resistance projects sub-$80 levels as the next potential rebound zone.

Short-term selling pressure outweighs institutional confidence
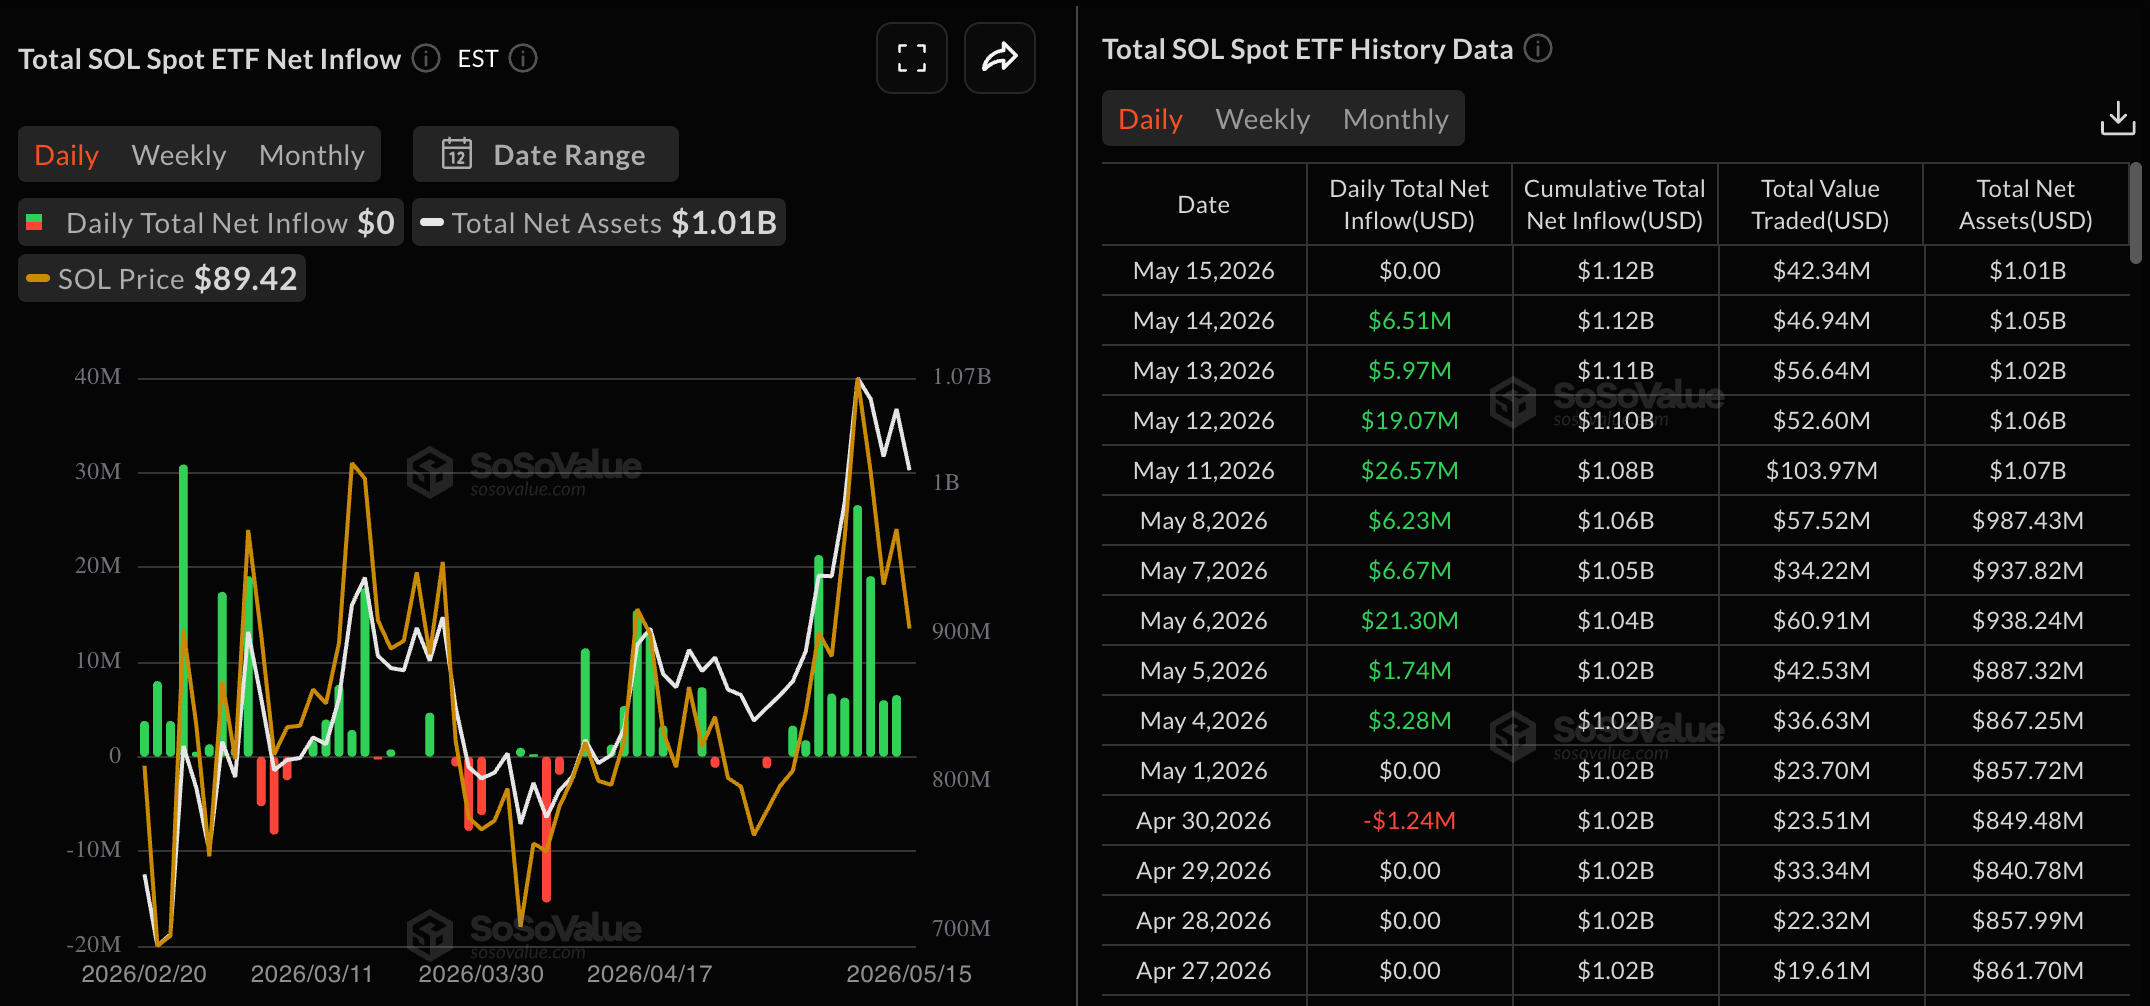
The US Solana spot ETFs recorded four consecutive days of inflows last week, totaling $58.12 million. This shows renewed and steady institutional support for Solana, with inflows reaching levels last seen in mid-December.
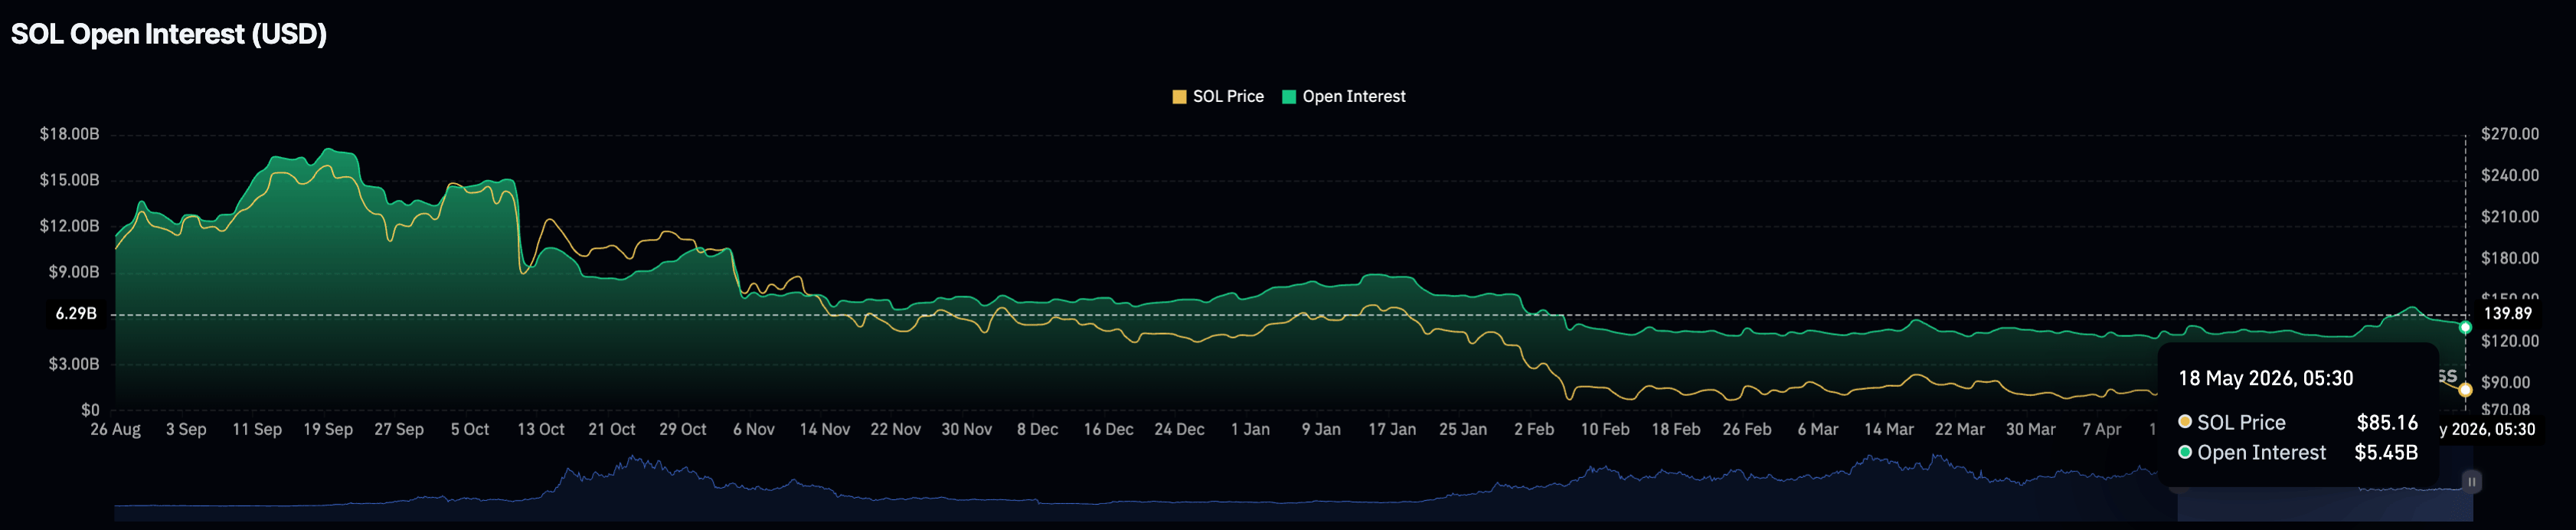
However, the broader crypto market pullback, which has led to over $600 million in liquidations, weighs on retail support for Solana. CoinGlass data shows the SOL futures Open Interest (OI) is down to $5.45 million, from $6.77 million on Tuesday, indicating a significant decline in the value of outstanding contracts. This wipeout of short-term retail participation reinforces the risk-off sentiment in SOL derivatives.
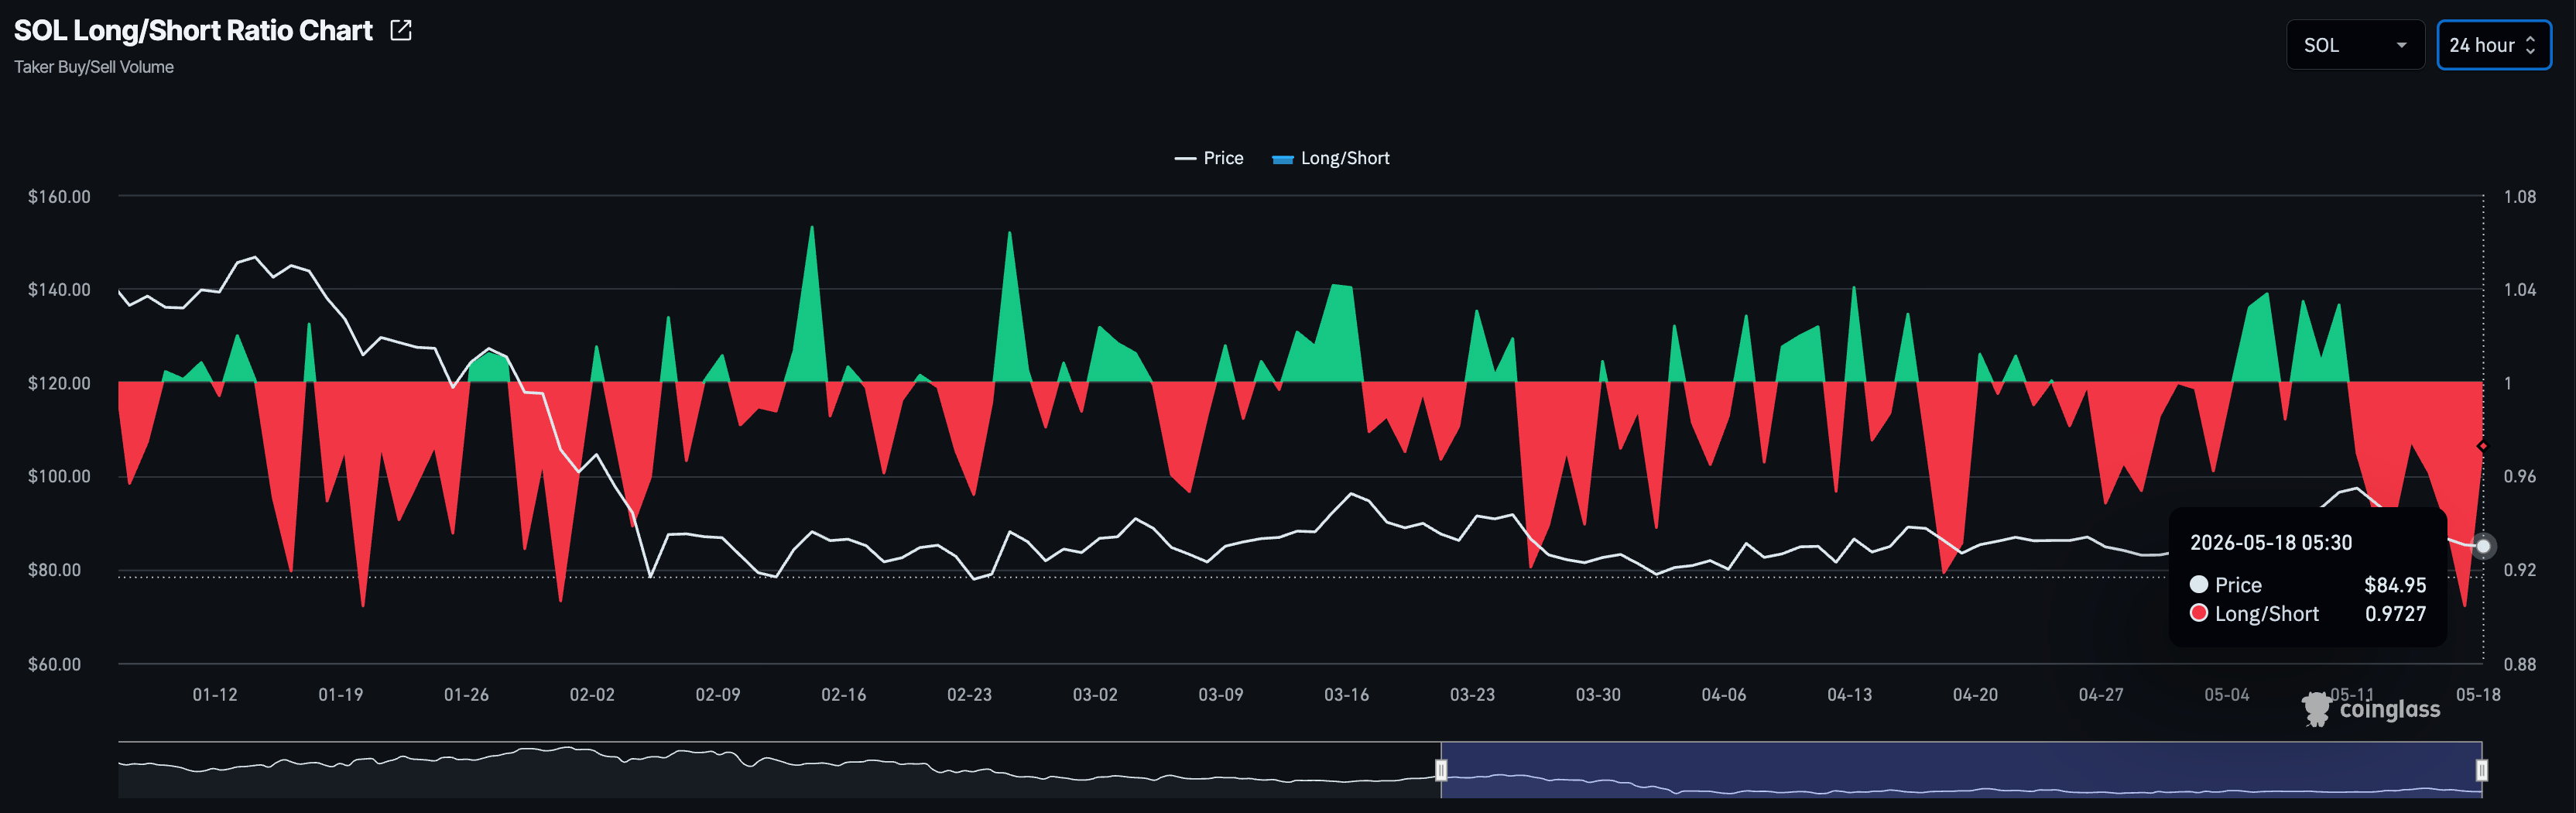
Additionally, the long-to-short ratio of 0.9727 remains mainly below the midline at 1, reaffirming the increased count of short positions.
Solana puts sub-$80 levels at risk as selling pressure grows
Solana remains under clear bearish pressure as price trades beneath the 50-day Exponential Moving Average (EMA) at $87.90, with the 100-day EMA at $93.26 and the 200-day EMA at $108.51 stacked higher and reinforcing a capped, bearish near-term backdrop. The path of least resistance aims toward the $77.60-$75.63 support zone, marked by the February 5 and 24 lows, respectively.
Momentum indicators align with this tone: the Relative Strength Index (RSI) hovers around 43, suggesting a steady increase in selling pressure as it approaches oversold conditions, while the Moving Average Convergence Divergence (MACD) slipped below the signal line on Saturday, indicating renewed downside momentum.
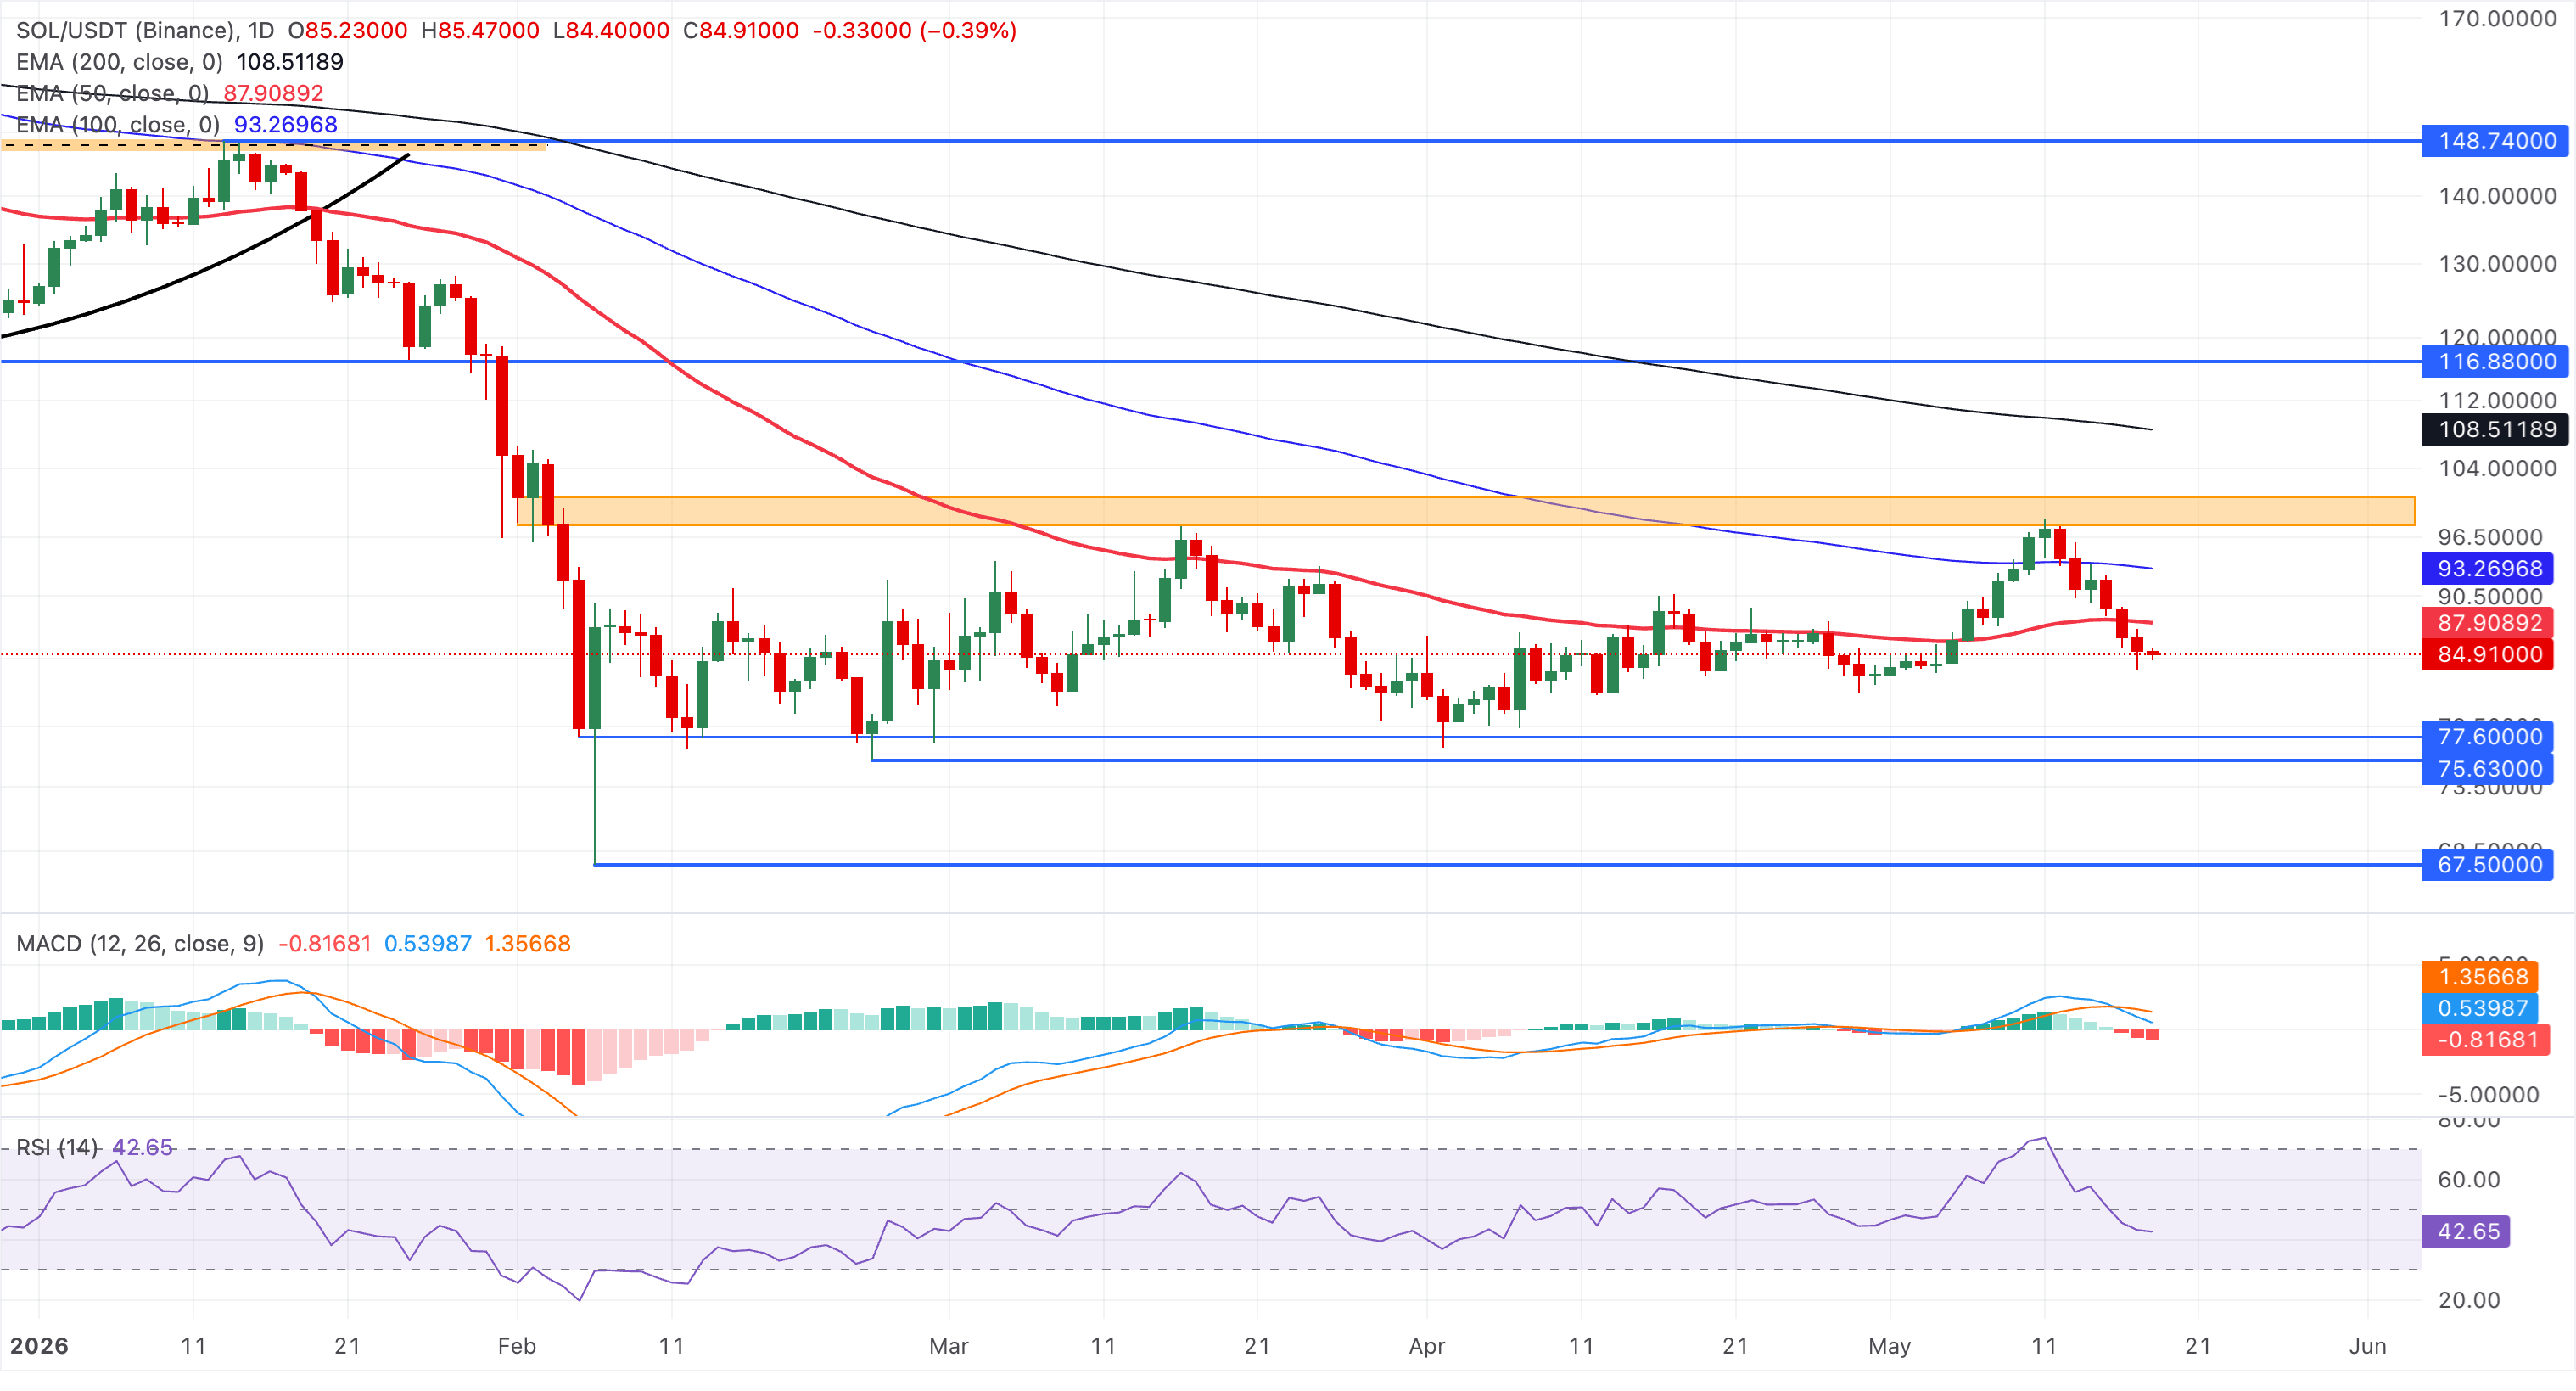
A daily close above the 50-day EMA barrier at $87.90 would be needed to ease immediate selling pressure and allow a corrective bounce toward the 100-day EMA at $93.26. Beyond these moving averages, the supply zone near $100 could potentially cap the next rebound to guard the 200-day EMA at $108.51.
(The technical analysis of this story was written with the help of an AI tool.)


