
Solana Price Forecast: Bears cap SOL below $75 as ETF, retail demand wanes
作者 Vishal Dixit
更新: 23 Jun 2026


熱門文章

Solana (SOL) edges below $72 on Tuesday, risking a third consecutive day of losses that could erase the 5% gains from Friday. SOL-focused Exchange Traded Funds (ETFs) reflect muted demand from institutional investors following a minor recovery last week.
- Solana trades around $72 on Tuesday as the 200-period EMA on the 4-hour chart capped a recovery on Monday.
- Institutional demand remains weak, with zero net flow on Monday, following over $7 million in inflows last week.
- Retail interest shifts bearish toward Solana as rising Open Interest and Volume amid negative funding rates, suggest short-side positional buildup.
Solana (SOL) edges below $72 on Tuesday, risking a third consecutive day of losses that could erase the 5% gains from Friday. SOL-focused Exchange Traded Funds (ETFs) reflect muted demand from institutional investors following a minor recovery last week. Meanwhile, retail trading activity hints at a bearish positional buildup amid rising Open Interest and volume, even as funding rates decline.
Solana risks added downside pressure from ETFs, derivatives markets
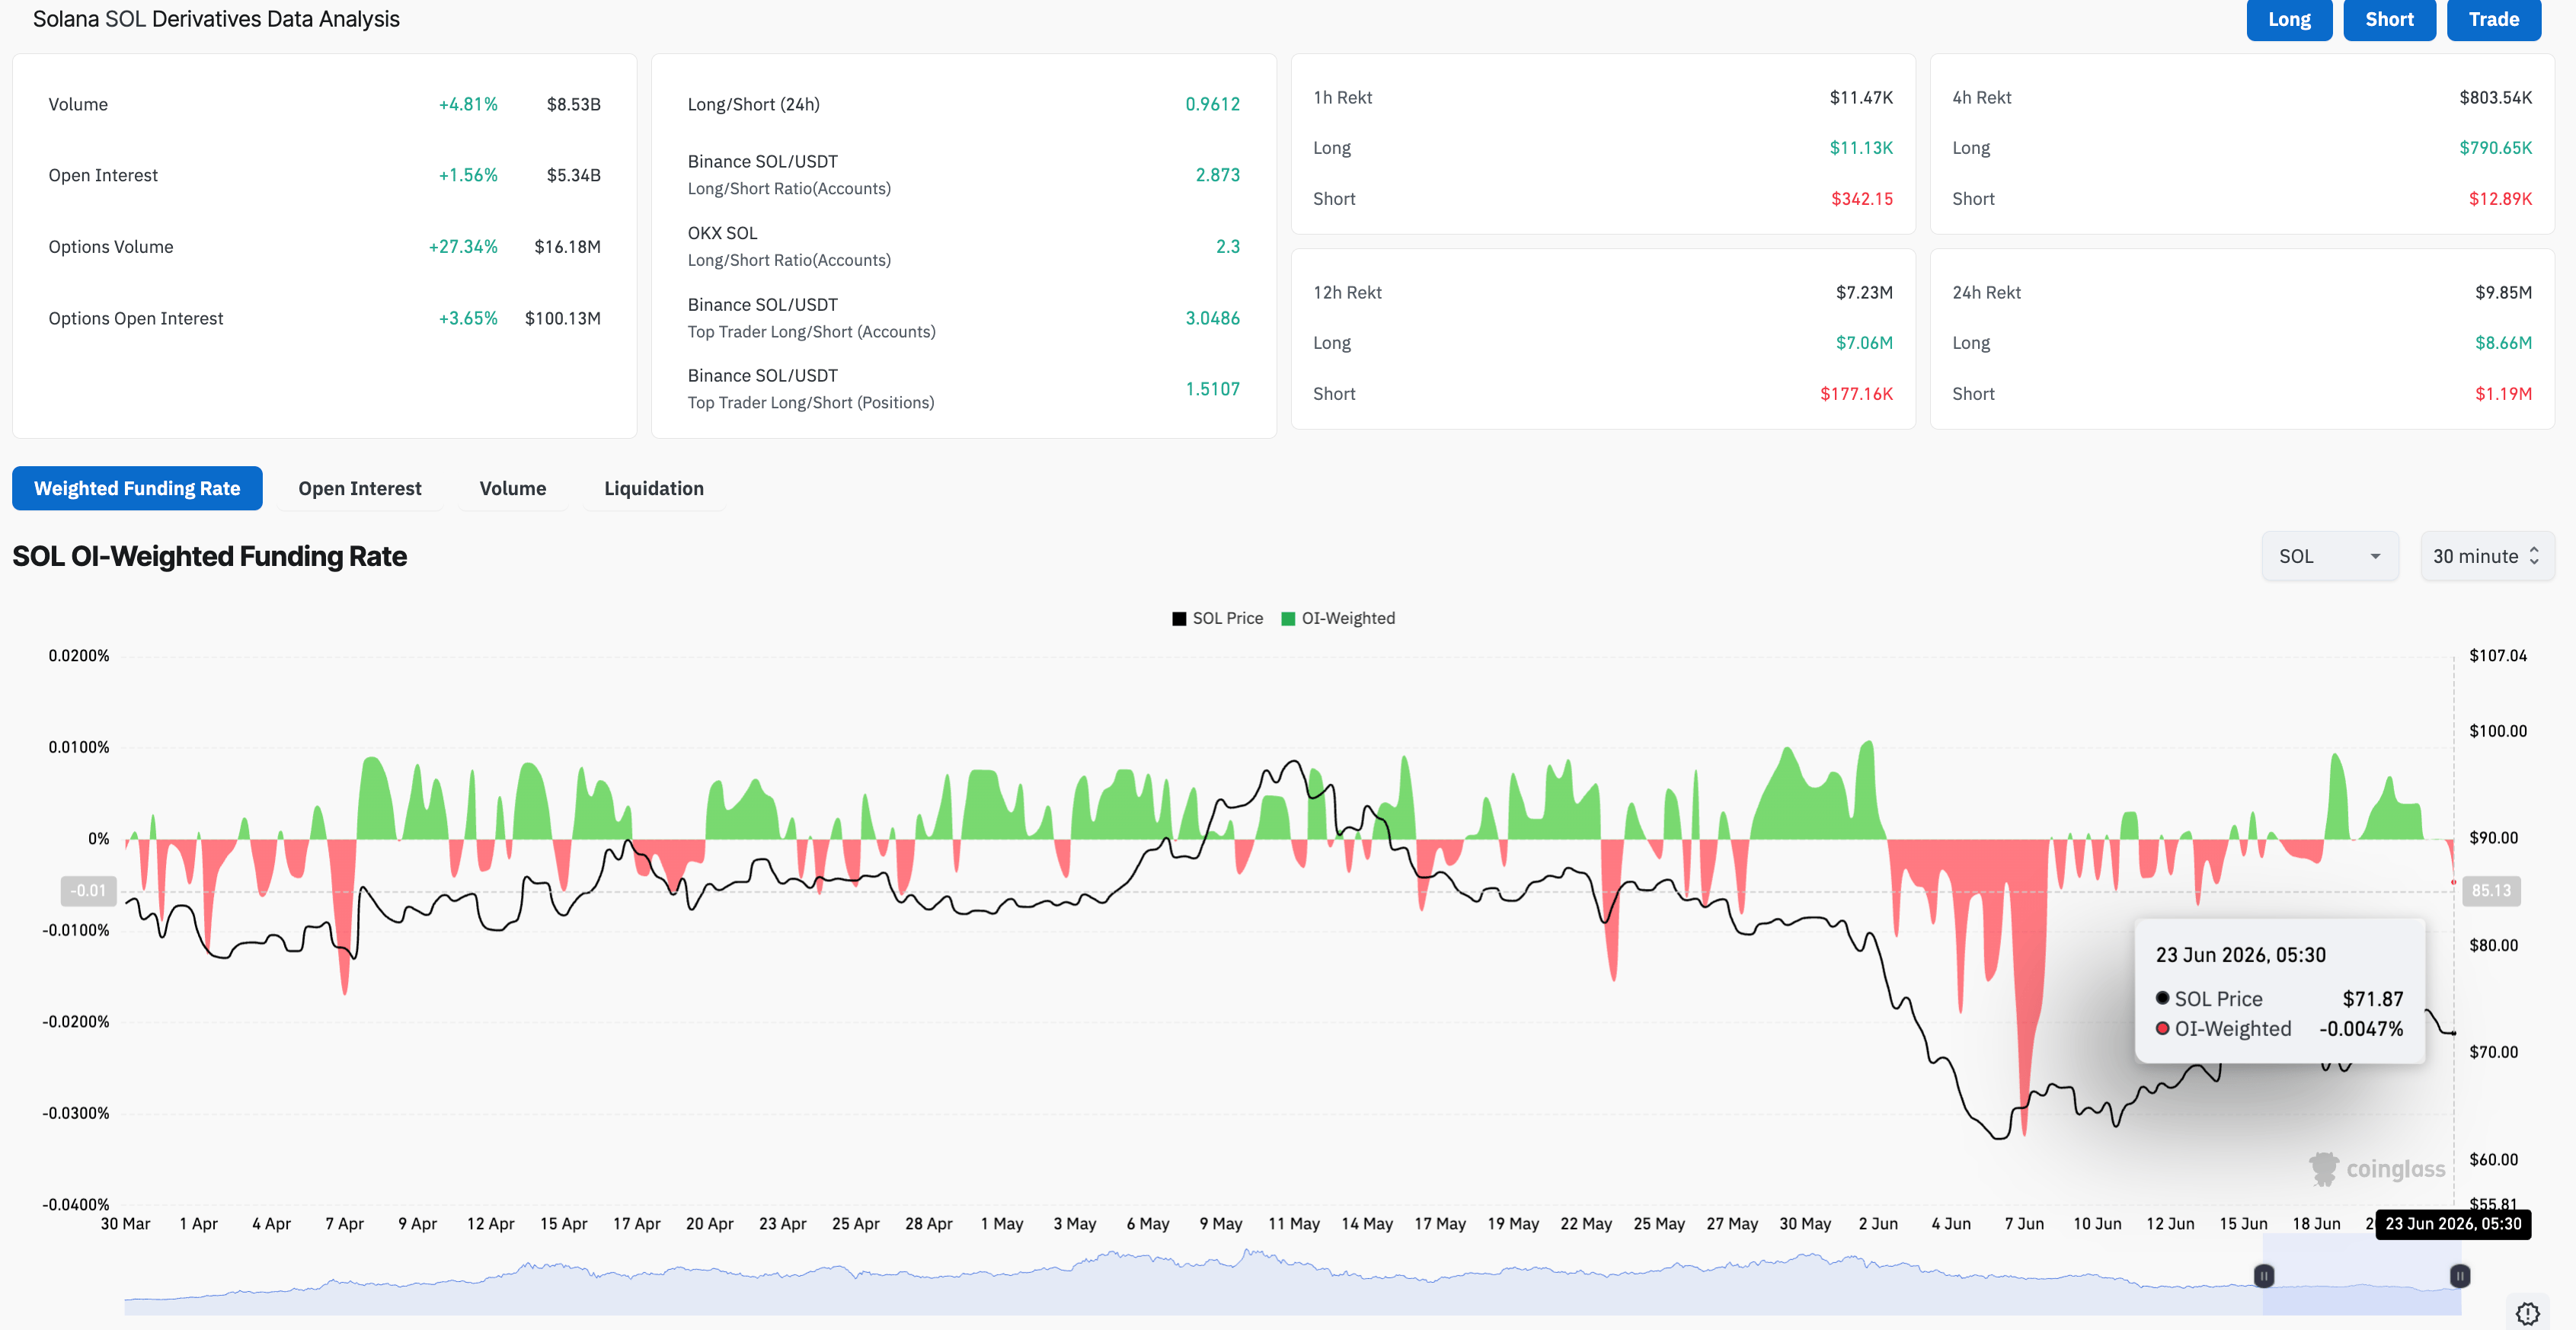
Retail and institutional demand for Solana ebbs and flows amid the lack of a broader market bullish narrative and additional downside pressure from macroeconomic factors. CoinGlass data shows that Solana futures Open Interest (OI) has edged higher to $5.34 billion, reflecting a positional buildup over the last 24 hours amid a roughly 5% surge in trading volume to $8.53 billion.
However, the funding rate dropped below zero to 0.0047% on Tuesday, suggesting a bearish shift in positional buildup, with traders willing to buy short positions at a premium.
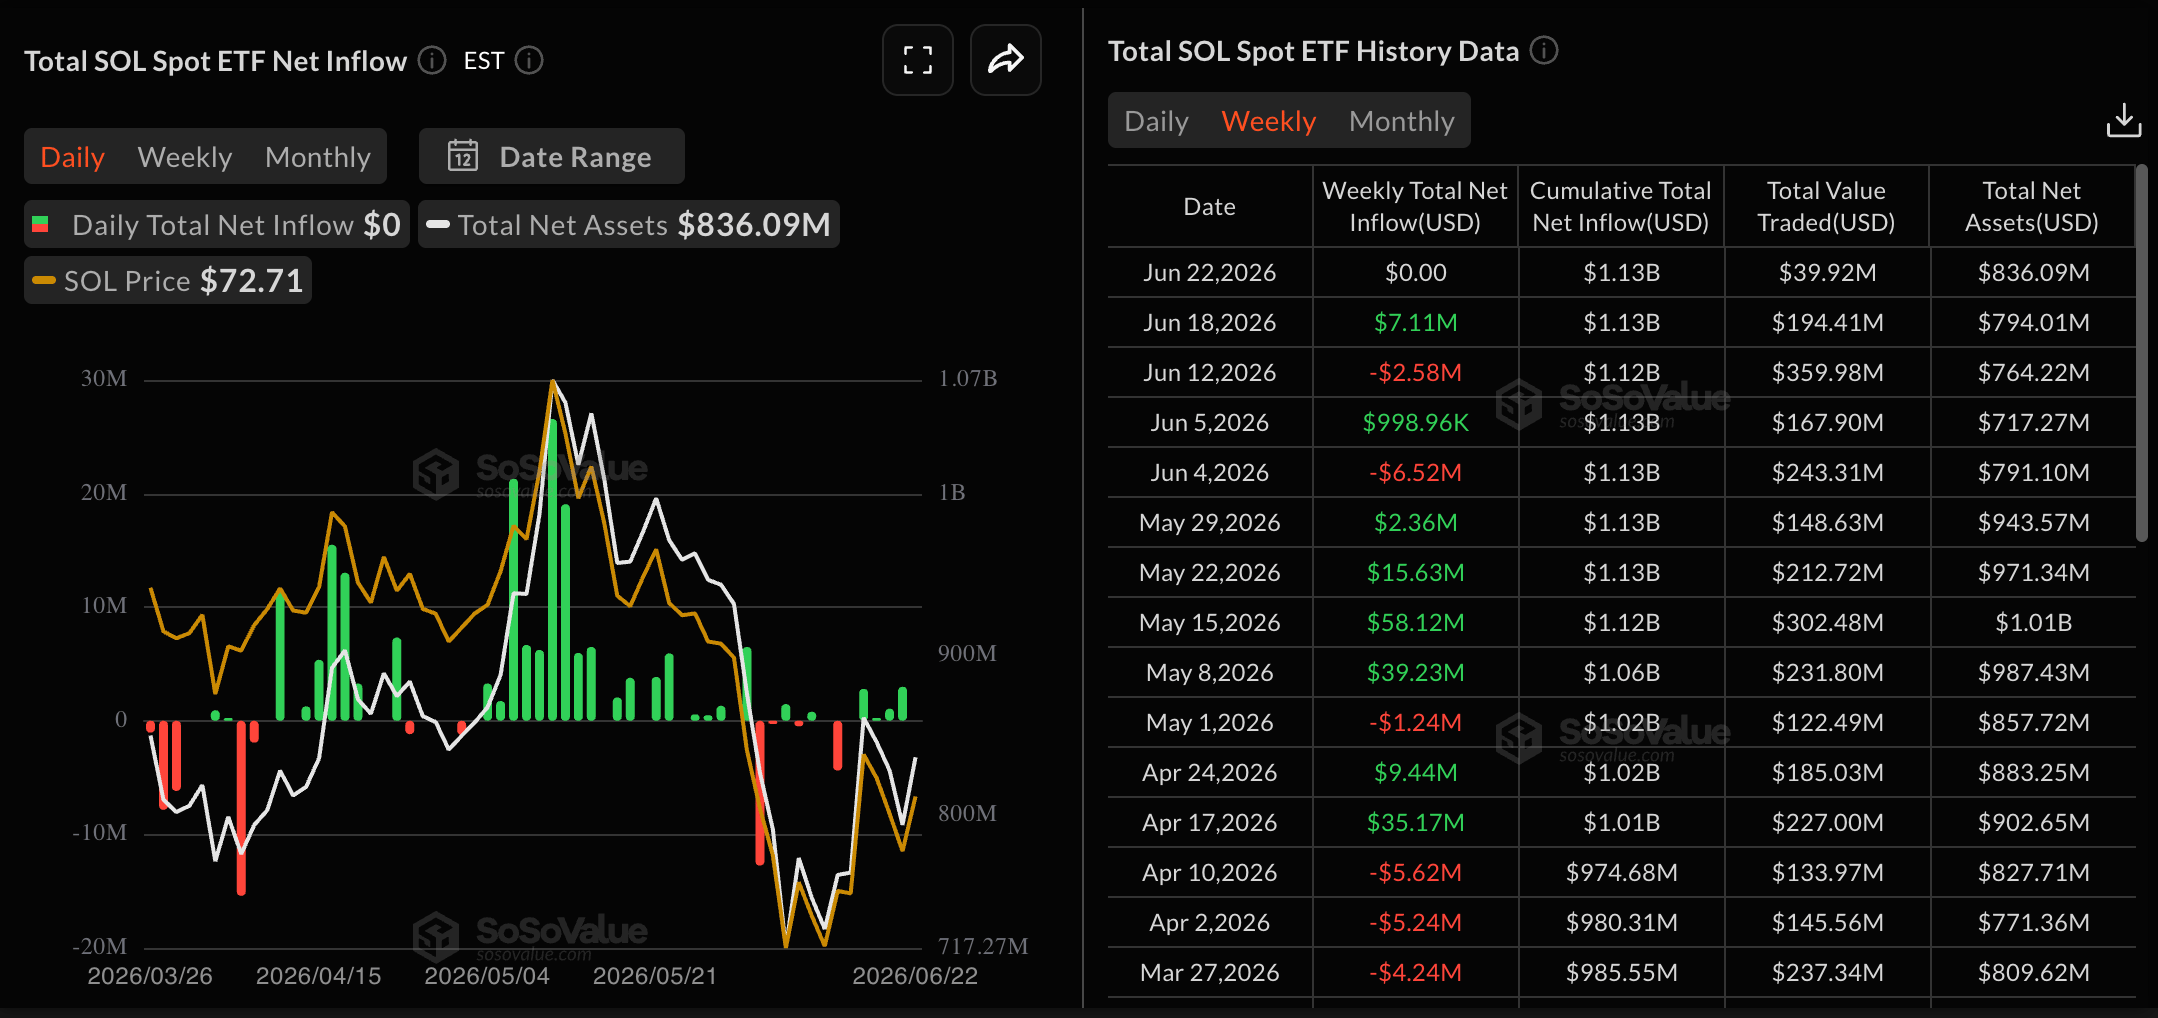
On the institutional side, the SOL-focused ETFs recorded zero inflows on Monday, down from $7.11 million last week. This slowdown marks a muted start to the week, raising concerns that institutions are further calibrating their holdings.
Solana risks further decline as bullish momentum wanes
Solana trades below $72 at press time on Tuesday, maintaining a neutral tone on the 4-hour chart as price consolidates above the 50-period Exponential Moving Average (EMA) at $71.62. A short-term support trendline connecting the June 6 and 19 lows reflects the short-term recovery trend, while being capped well below the 200-period EMA at $74.29.
From a technical perspective, SOL should surpass the 200-period EMA at $74.28 and the June 15 high at $76.09 for a sustained uptrend. Looking up, a decisive breakout could open the path toward the 127.2% and 161.8% Fibonacci extension levels, measured over the upswing from $60.13 to $76.09, at $81.12 and $88.00, respectively.
Near-term momentum cools, with the Relative Strength Index (RSI) easing toward the midline as buying pressure wanes. At the same time, the Moving Average Convergence Divergence (MACD) slips marginally below its signal line, hinting at fading upside pressure rather than an outright bearish reversal.
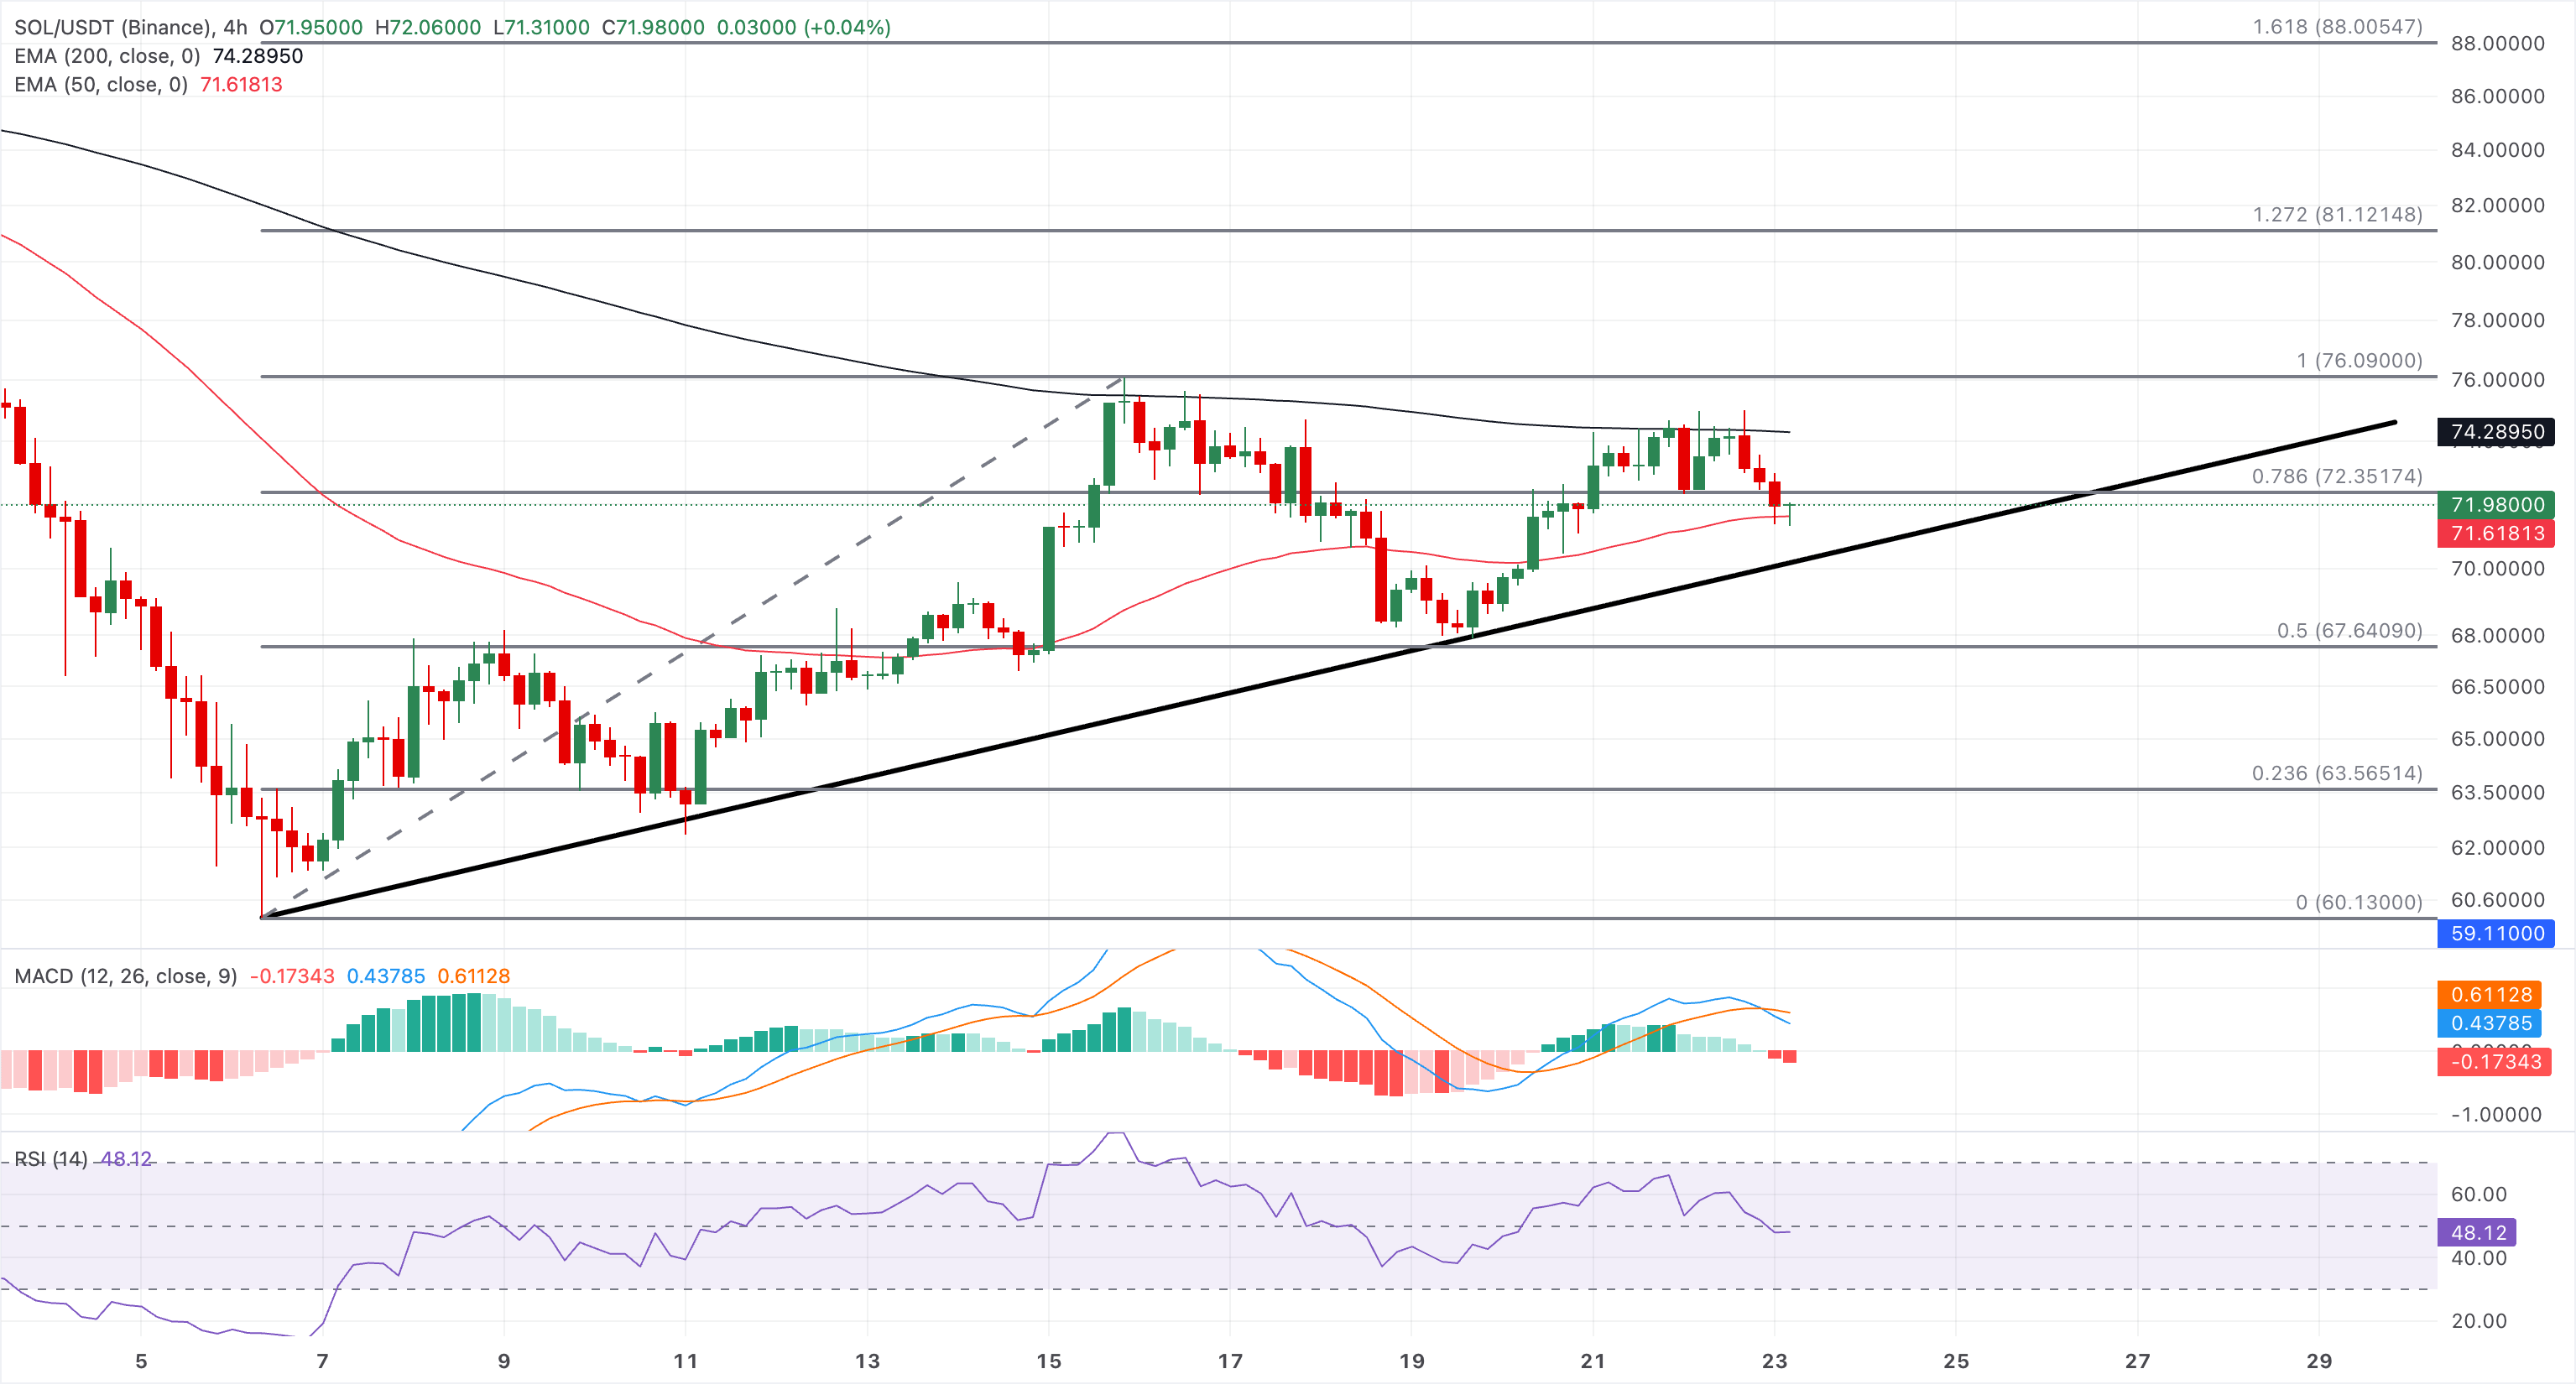
Looking down, immediate support comes from the rising trendline and the 50-period EMA at $71.61, which guards the 50% retracement level at $67.64.
(The technical analysis of this story was written with the help of an AI tool.)

超過一百萬用戶依賴 FXStreet 獲取即時市場數據、圖表工具、專家洞見與外匯新聞。其全面的經濟日曆與教育網路研討會協助交易者保持資訊領先、做出審慎決策。FXStreet 擁有約 60 人的團隊,分布於巴塞隆納總部及全球各地。
閱讀更多


