
Top 3 Price Prediction: Bitcoin, Ethereum, Ripple – BTC, ETH and XRP weaken near key supports, risks deeper drop
作者 Manish Chhetri
更新: 3 Apr 2026


熱門文章

Bitcoin (BTC), Ethereum (ETH), and Ripple (XRP) trade in the red on Friday, with prices drifting closer to key support levels after failing to sustain recent recoveries. BTC and XRP are near key support levels, while ETH faces rejection at a critical level.
- Bitcoin extends its decline on Friday, nearing key support; a breakdown would suggest a deeper correction.
- Ethereum price faces a correction from its 50-day EMA at $2,150, signaling a potential short-term pullback.
- XRP is approaching the horizontal support at $1.30, a close below suggests further correction.
Bitcoin (BTC), Ethereum (ETH), and Ripple (XRP) trade in the red on Friday, with prices drifting closer to key support levels after failing to sustain recent recoveries. BTC and XRP are near key support levels, while ETH faces rejection at a critical level. Momentum indicators for these top three cryptocurrencies suggest fading bullish strength, and a failure to hold key support could open the door to a deeper correction in the near term.
Bitcoin could extend deeper losses if it closes below key support
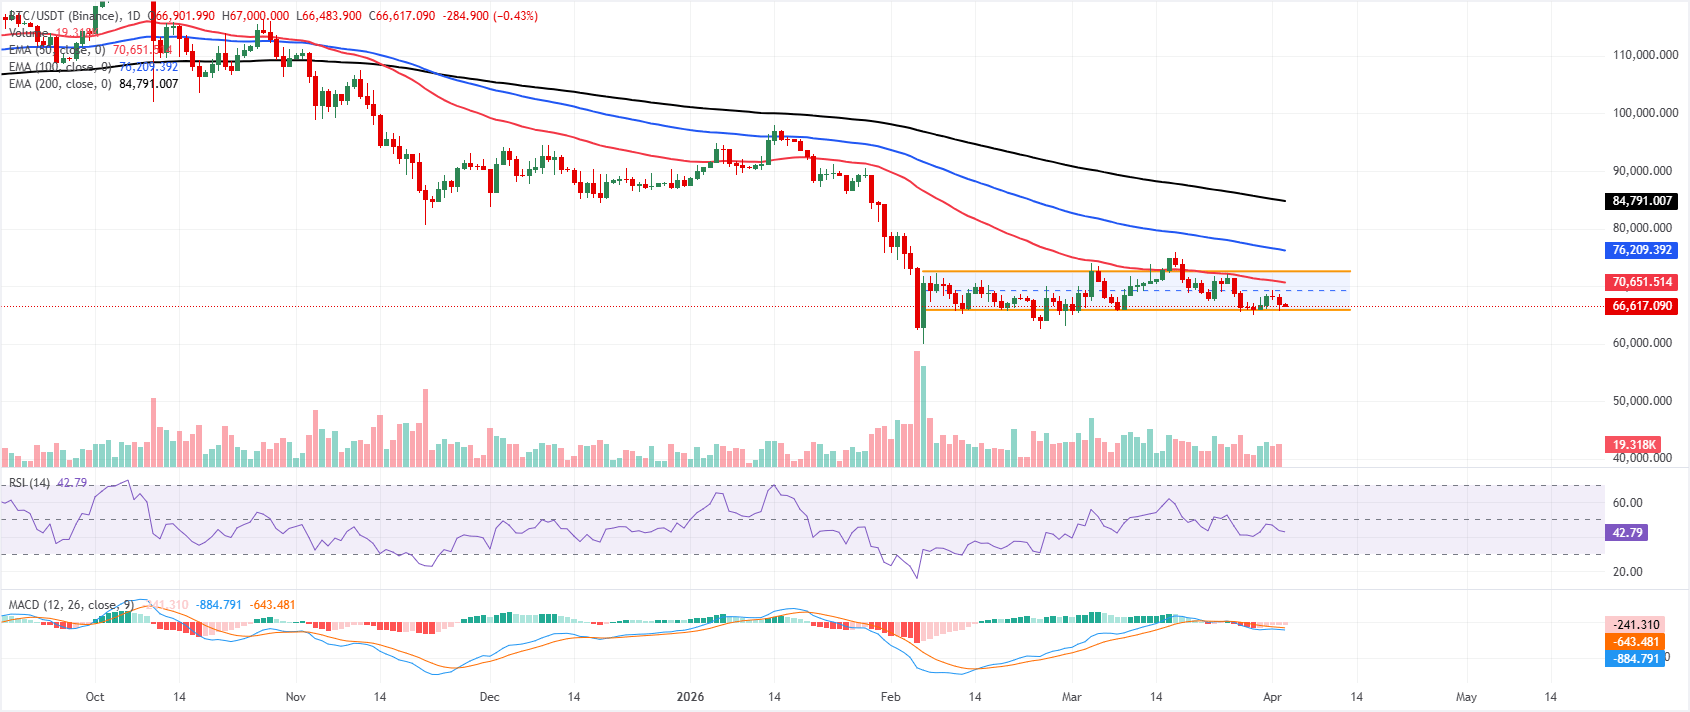
Bitcoin price is extending its correction, trading below $66,700 on Friday, nearly erasing the recovery from earlier this week. The near-term bias is mildly bearish as price holds within a parallel channel and gravitates toward its lower boundary near $65,900, indicating sellers retain control of the recent sequence of lower highs. BTC trades below the clustered 50-day, 100-day, and 200-day Exponential Moving Averages (EMAs), reinforcing a downside-skewed backdrop despite the recent bounce attempts.
The Relative Strength Index (RSI) on the daily chart at 42 stays below the 50 midline, signaling persistent, though not extreme, bearish momentum, while the Moving Average Convergence Divergence (MACD) indicator slips further below zero with the line running under its signal line, suggesting downside pressure remains in play.
Immediate support is near the channel floor at $65,900, with a break exposing the key psychological level at $60,000.
On the upside, initial resistance emerges near the midpoint of the channel, around $69,200, just ahead of the channel top near $72,600, where the consolidating boundary tops roughly converge with the 50-day EMA to form a key barrier. A daily close above $72,600 would signal a bullish break from the sideways structure and open the door toward the 100-day EMA near $76,200, while sustained trade below $65,900 would extend the current corrective leg within the broader cycle.
Ethereum faces rejection at the 50-day EMA
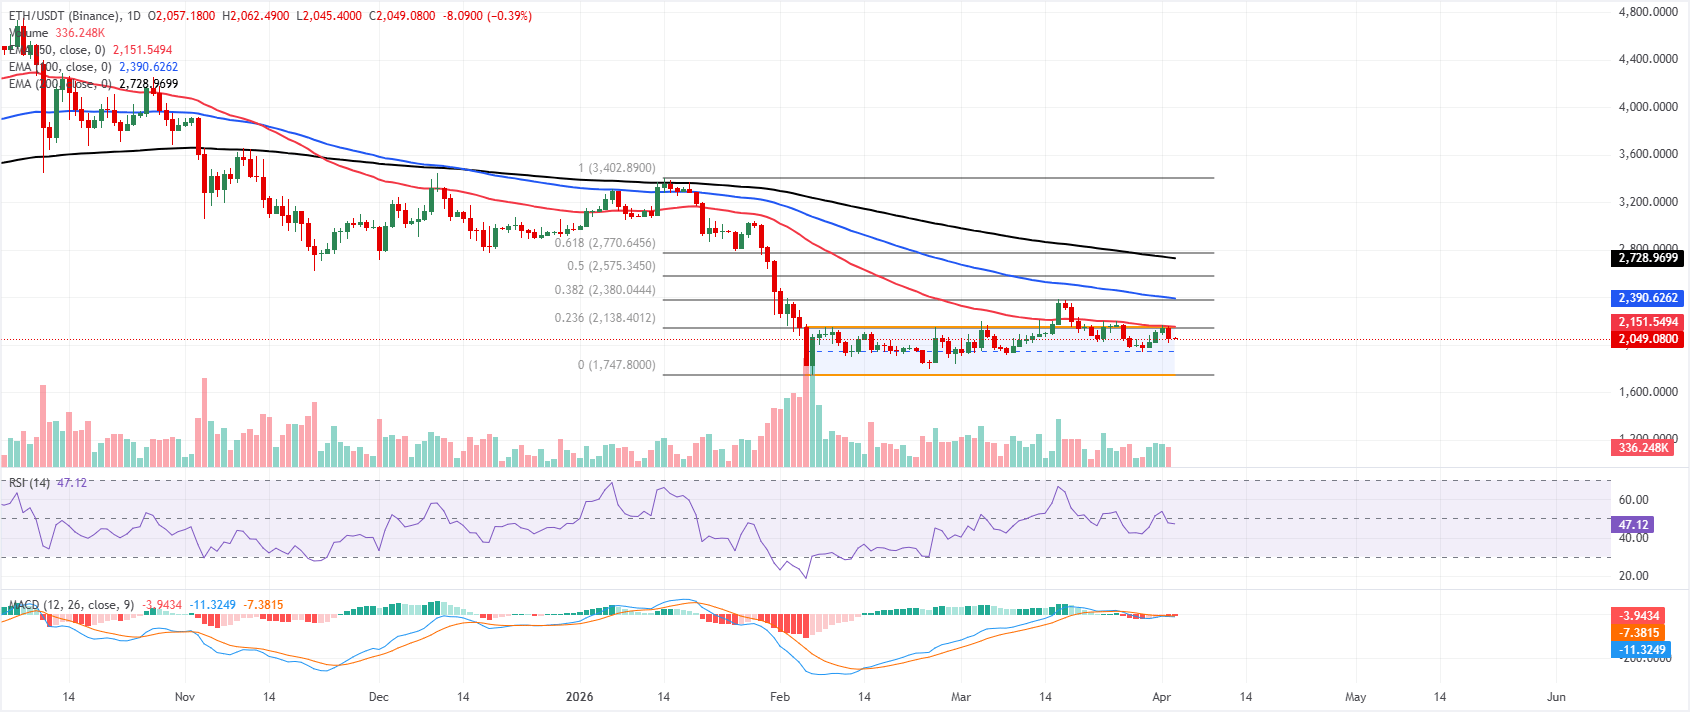
Ethereum price is trading at $2,049 on Friday. The near-term bias stays bearish as price holds well below the horizontal channel top near $2,148 and remains capped under the 23.6% Fibonacci retracement at $2,138, measured from the $1,747 low to the $3,402 high. The cluster of 50-day, 100-day, and 200-day EMAs above $2,150 highlights a firmly dominant higher-timeframe downtrend weighing on rebounds.
Daily RSI around 47 indicates momentum is slightly tilted to the downside, while the MACD indicator trades below the signal line and near the zero line, with a negative bias that reinforces fading upside pressure within the channel.
Initial resistance stands at the 23.6% retracement at $2,138, with the channel top near $2,148 acting as a stronger cap as long as bears defend the broader trend of lower highs. A daily close above $2,148 would be needed to challenge the 38.2% retracement at $2,380 and start neutralizing the bearish structure.
On the downside, immediate support emerges at $2,000 ist key psychological level, ahead of the channel midpoint at $1,950. Further weakness and a close below this level could extend the decline toward the channel floor, aligning with $1,750 as a more strategic support zone if selling pressure persists.
XRP nears key support at $1.30
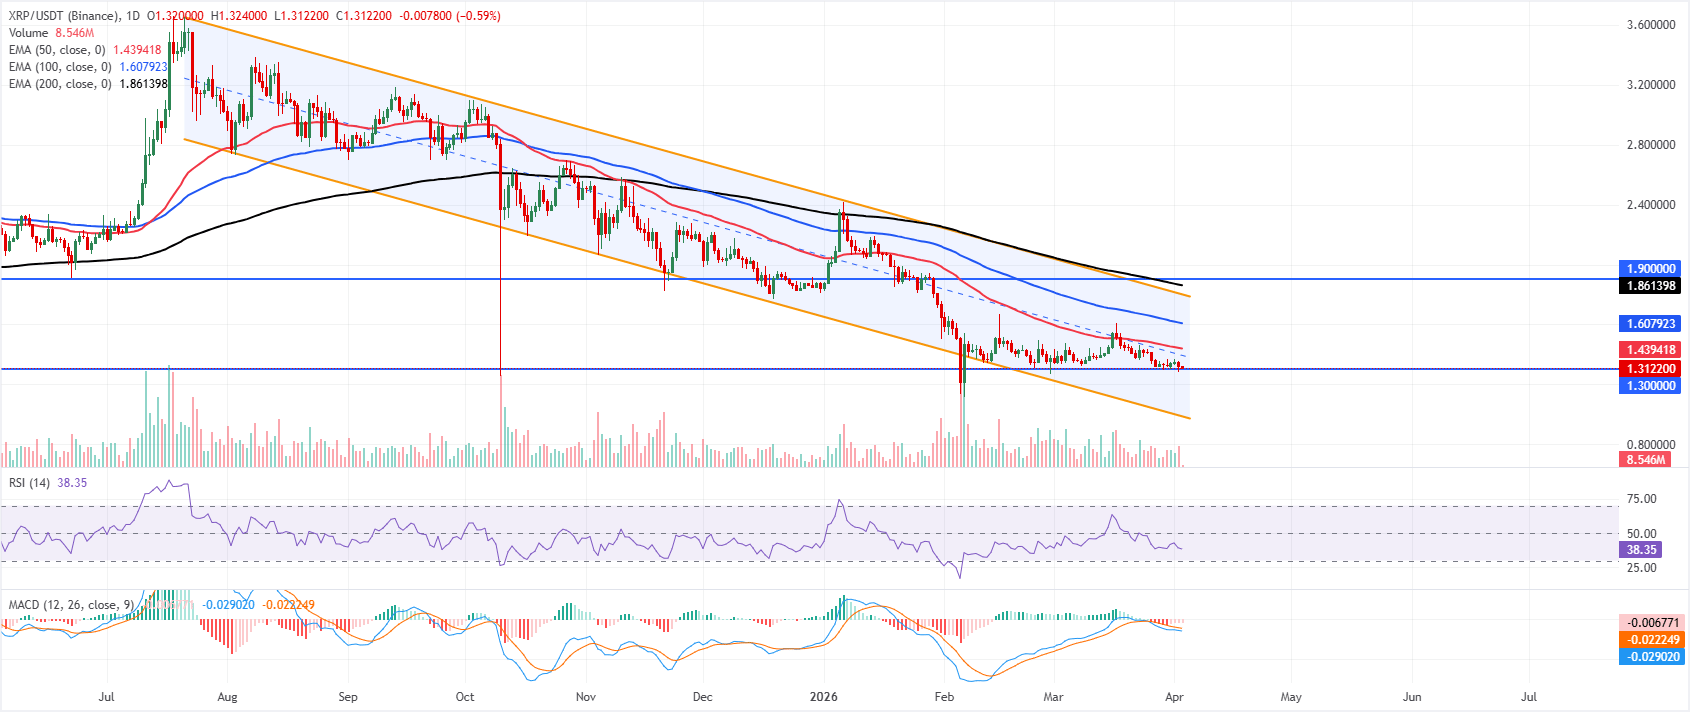
XRP price is trading at $1.31 on Friday. The near-term bias is mildly bearish as price holds near the lower half of the established descending channel, with spot anchored well below the 50-day, 100-day, and 200-day EMAs, which continue to fan out above the market.
The RSI on the daily chart at 38 signals persistent negative momentum, while the MACD indicator remains below its signal line and near the zero mark, suggesting fading bullish attempts and reinforcing downside pressure within the broader corrective structure.
Immediate support is at $1.30, where the horizontal line converges with the lower area of the descending channel. A daily close below this level would expose the channel floor near $0.99 as the next downside objective.
On the upside, initial resistance emerges near the 50-day EMA around $1.44, followed by the channel mid-area near $1.80, while the more distant horizontal barrier at $1.90 caps the broader recovery outlook. A sustained move back above the 50-day average would be required to ease the current bearish bias and refocus attention on the channel's upper boundary.
(The technical analysis of this story was written with the help of an AI tool.)
Cryptocurrency prices FAQs
Token launches influence demand and adoption among market participants. Listings on crypto exchanges deepen the liquidity for an asset and add new participants to an asset’s network. This is typically bullish for a digital asset.
A hack is an event in which an attacker captures a large volume of the asset from a DeFi bridge or hot wallet of an exchange or any other crypto platform via exploits, bugs or other methods. The exploiter then transfers these tokens out of the exchange platforms to ultimately sell or swap the assets for other cryptocurrencies or stablecoins. Such events often involve an en masse panic triggering a sell-off in the affected assets.
Macroeconomic events like the US Federal Reserve’s decision on interest rates influence crypto assets mainly through the direct impact they have on the US Dollar. An increase in interest rate typically negatively influences Bitcoin and altcoin prices, and vice versa. If the US Dollar index declines, risk assets and associated leverage for trading gets cheaper, in turn driving crypto prices higher.
Halvings are typically considered bullish events as they slash the block reward in half for miners, constricting the supply of the asset. At consistent demand if the supply reduces, the asset’s price climbs.

超過一百萬用戶依賴 FXStreet 獲取即時市場數據、圖表工具、專家洞見與外匯新聞。其全面的經濟日曆與教育網路研討會協助交易者保持資訊領先、做出審慎決策。FXStreet 擁有約 60 人的團隊,分布於巴塞隆納總部及全球各地。
閱讀更多


