
Top 3 Price Prediction: Bitcoin, Ethereum, Ripple – BTC holds gains, ETH closes above key resistance, XRP eyes bullish channel breakout
作者 Manish Chhetri
更新: 11 May 2026


熱門文章

Bitcoin (BTC), Ethereum (ETH) and Ripple (XRP) hover around key levels on Monday after surging nearly 5%, 2% and 6%, respectively, in the previous week. BTC holds above $81,000 while ETH closes above the key resistance zone.
- Bitcoin hovers at $81,200 on Monday after rallying nearly 5% in the previous week.
- Ethereum closes above 200-day EMA at $2,342, suggesting a rally ahead.
- XRP is nearing the upper boundary of its descending channel, with a breakout potentially triggering an upside move.
Bitcoin (BTC), Ethereum (ETH) and Ripple (XRP) hover around key levels on Monday after surging nearly 5%, 2% and 6%, respectively, in the previous week. BTC holds above $81,000 while ETH closes above the key resistance zone. On the other hand, XRP continues to edge toward a potential breakout from its descending channel pattern. If bullish momentum sustains, these top three cryptocurrencies could extend their gains in the near term.
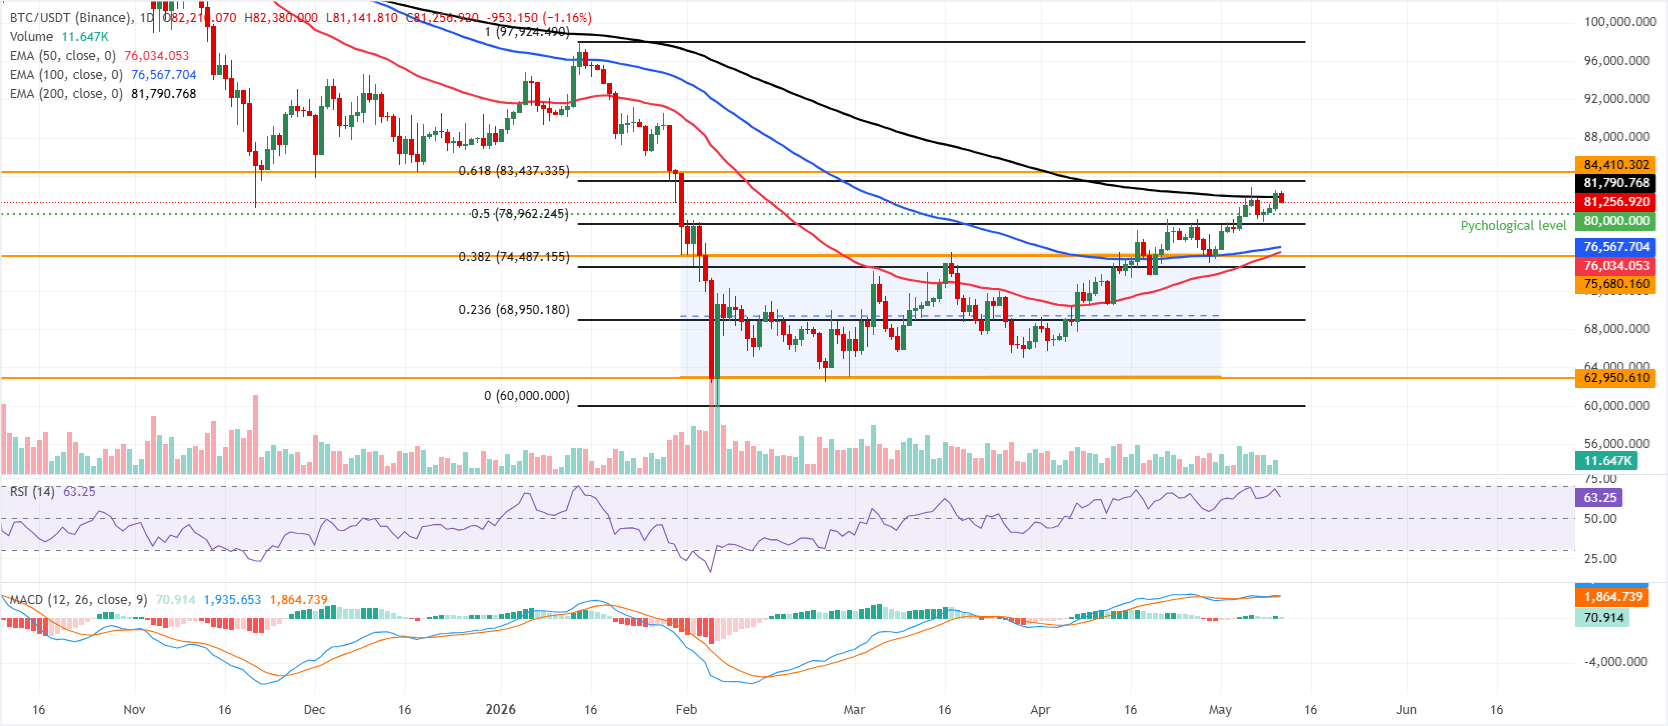
Bitcoin holds gains
Bitcoin price is trading at $81,200, holding a constructive bullish bias as it consolidates above a dense band of Exponential Moving Averages (EMAs) and structural support. BTC price action is trading above the 50-day, 100-day, and 200-day EMAs, which cluster between roughly $76,000 and $82,000, suggesting the broader uptrend remains intact despite the recent pullback.
The Relative Strength Index (RSI) eases back toward the low-60s from near-overbought territory, hinting at moderating but still positive momentum. At the same time, the Moving Average Convergence Divergence (MACD) indicator remains in positive territory even as its recent downtick and softer histogram hint at a waning upside impulse rather than a full-fledged reversal.
On the topside, initial resistance is seen at the 61.8% Fibonacci retracement (drawn from the January high to the February low) at about $83,437, with a more substantial cap emerging at the horizontal barrier near $84,410.
On the downside, immediate support is located around the psychological $80,000 handle, reinforced by the 50% retracement at roughly $78,962 and the upper boundary of the descending parallel channel in the mid-$75,000s; as long as BTC holds above these clustered floors and the underlying EMAs, pullbacks are likely to be viewed as corrective within the broader bullish structure.
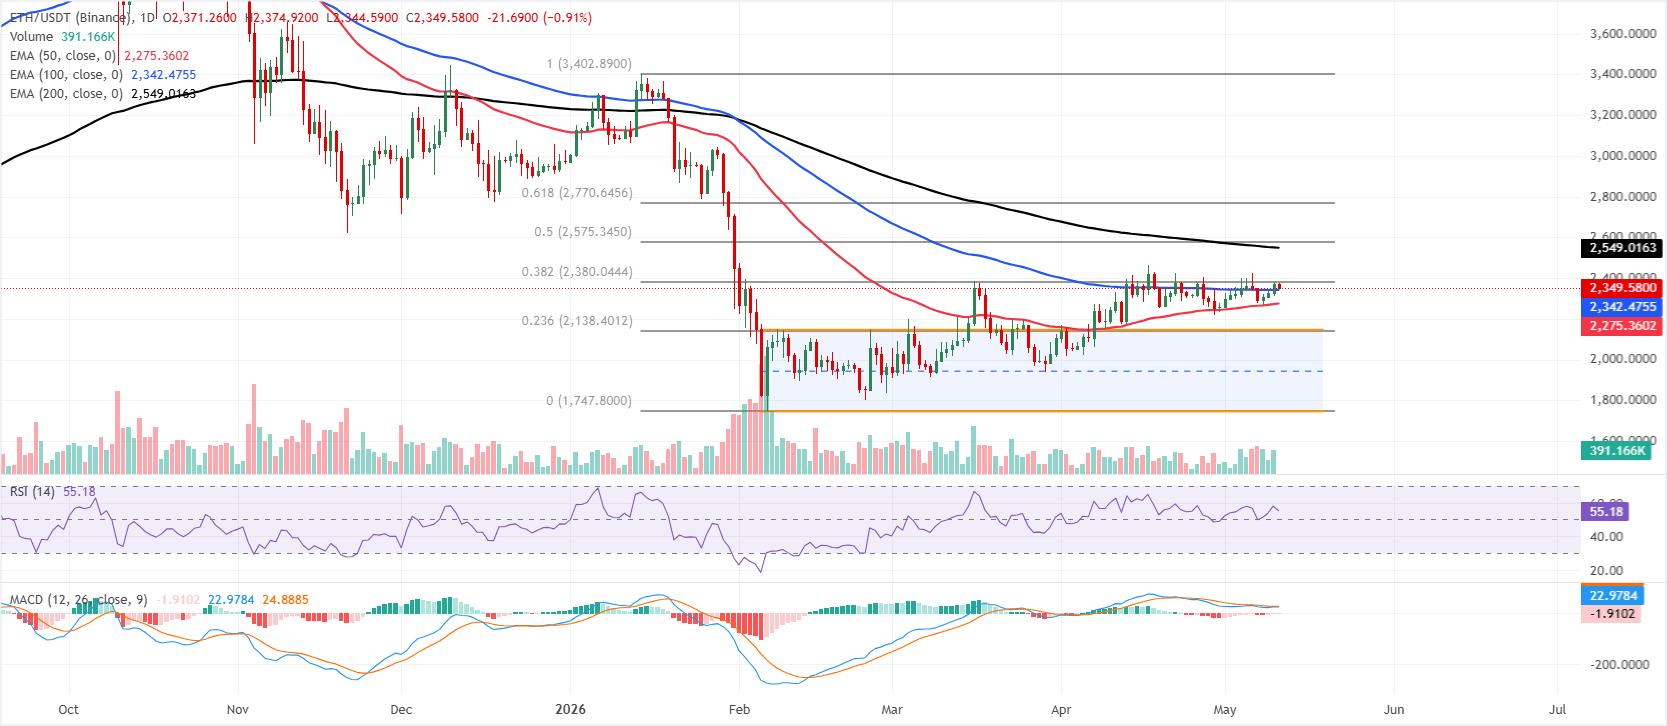
Ethereum could extend gains if the 200-day EMA holds
Ethereum price is trading around $2,344, holding above the 50-day and 100-day EMAs at roughly $2,275 and $2,342, suggesting a cautiously constructive tone, while the broader trend remains capped beneath the 200-day EMA near $2,549.
The RSI on the daily chart hovers just above the neutral 50 mark, hinting at mild bullish momentum, while the MACD remains slightly below zero, suggesting that upside traction is still tentative despite the recent stabilization.
On the topside, initial resistance is seen at the 38.2% Fibonacci retracement of the broader downswing near $2,380, with a break above this level exposing the more significant barrier at the 200-day EMA around $2,549.
On the downside, immediate support is provided by the 100-day EMA at about $2,342, followed by the 50-day EMA near $2,275; a deeper pullback would bring the 23.6% Fibonacci retracement at roughly $2,138.
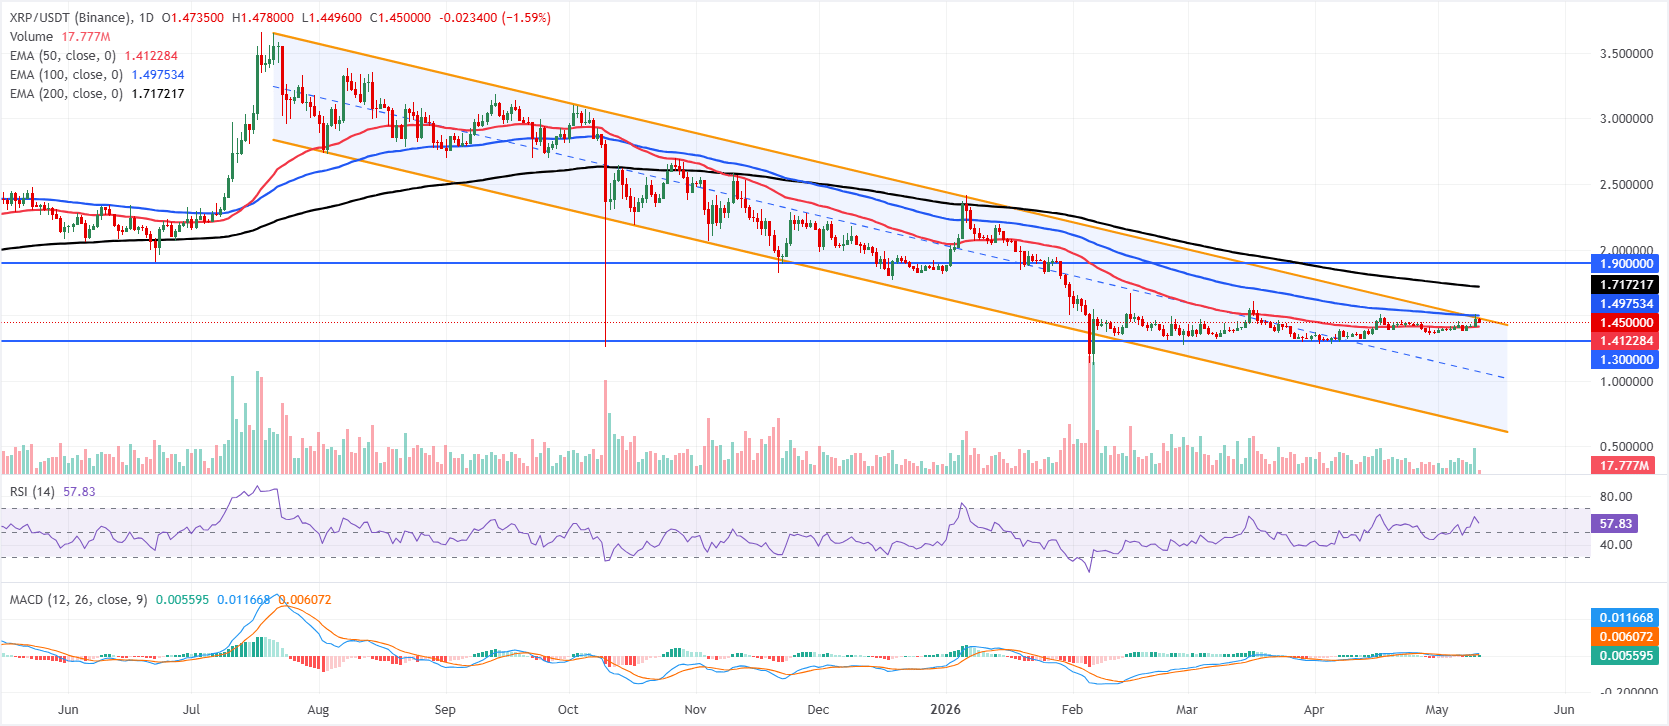
XRP nears the upper channel boundary of its descending channel
XRP price is trading at $1.45 on Monday, up over 6% from the previous week. XRP holds above the 50-day EMA at $1.41, hinting at a mildly constructive near-term tone, but it remains capped beneath the 100-day EMA at $1.49 and the 200-day EMA at $1.71, which keep the broader trend under pressure.
The RSI on the daily chart is around 58, indicating firm but not stretched bullish momentum. At the same time, the MACD indicator remains marginally positive above the zero line, suggesting buying interest is building but still lacks strong follow-through against the established downward parallel channel.
On the topside, initial resistance is aligned with the upper boundary of the descending channel near $1.47, followed by the 100-day EMA at $1.49; a sustained break above these levels would open the way toward the 200-day EMA at $1.71 and the more distant horizontal barrier at $1.90.
On the downside, immediate support is provided by the 50-day EMA at $1.41, ahead of the horizontal floor at $1.30, with the channel’s lower boundary down at $0.66 acting as the last major medium-term safeguard should sellers regain control.
(The technical analysis of this story was written with the help of an AI tool.)
Cryptocurrency prices FAQs
Token launches influence demand and adoption among market participants. Listings on crypto exchanges deepen the liquidity for an asset and add new participants to an asset’s network. This is typically bullish for a digital asset.
A hack is an event in which an attacker captures a large volume of the asset from a DeFi bridge or hot wallet of an exchange or any other crypto platform via exploits, bugs or other methods. The exploiter then transfers these tokens out of the exchange platforms to ultimately sell or swap the assets for other cryptocurrencies or stablecoins. Such events often involve an en masse panic triggering a sell-off in the affected assets.
Macroeconomic events like the US Federal Reserve’s decision on interest rates influence crypto assets mainly through the direct impact they have on the US Dollar. An increase in interest rate typically negatively influences Bitcoin and altcoin prices, and vice versa. If the US Dollar index declines, risk assets and associated leverage for trading gets cheaper, in turn driving crypto prices higher.
Halvings are typically considered bullish events as they slash the block reward in half for miners, constricting the supply of the asset. At consistent demand if the supply reduces, the asset’s price climbs.

超過一百萬用戶依賴 FXStreet 獲取即時市場數據、圖表工具、專家洞見與外匯新聞。其全面的經濟日曆與教育網路研討會協助交易者保持資訊領先、做出審慎決策。FXStreet 擁有約 60 人的團隊,分布於巴塞隆納總部及全球各地。
閱讀更多


