
Top 3 Price Prediction: Bitcoin, Ethereum, Ripple – BTC holds steady, ETH tests support, XRP weakens amid renewed US–Iran Strait of Hormuz tensions
作者 Manish Chhetri
更新: 20 Apr 2026


熱門文章

Bitcoin (BTC), Ethereum (ETH) and Ripple (XRP) surged more than 4%, 3% and 5% in the previous week.
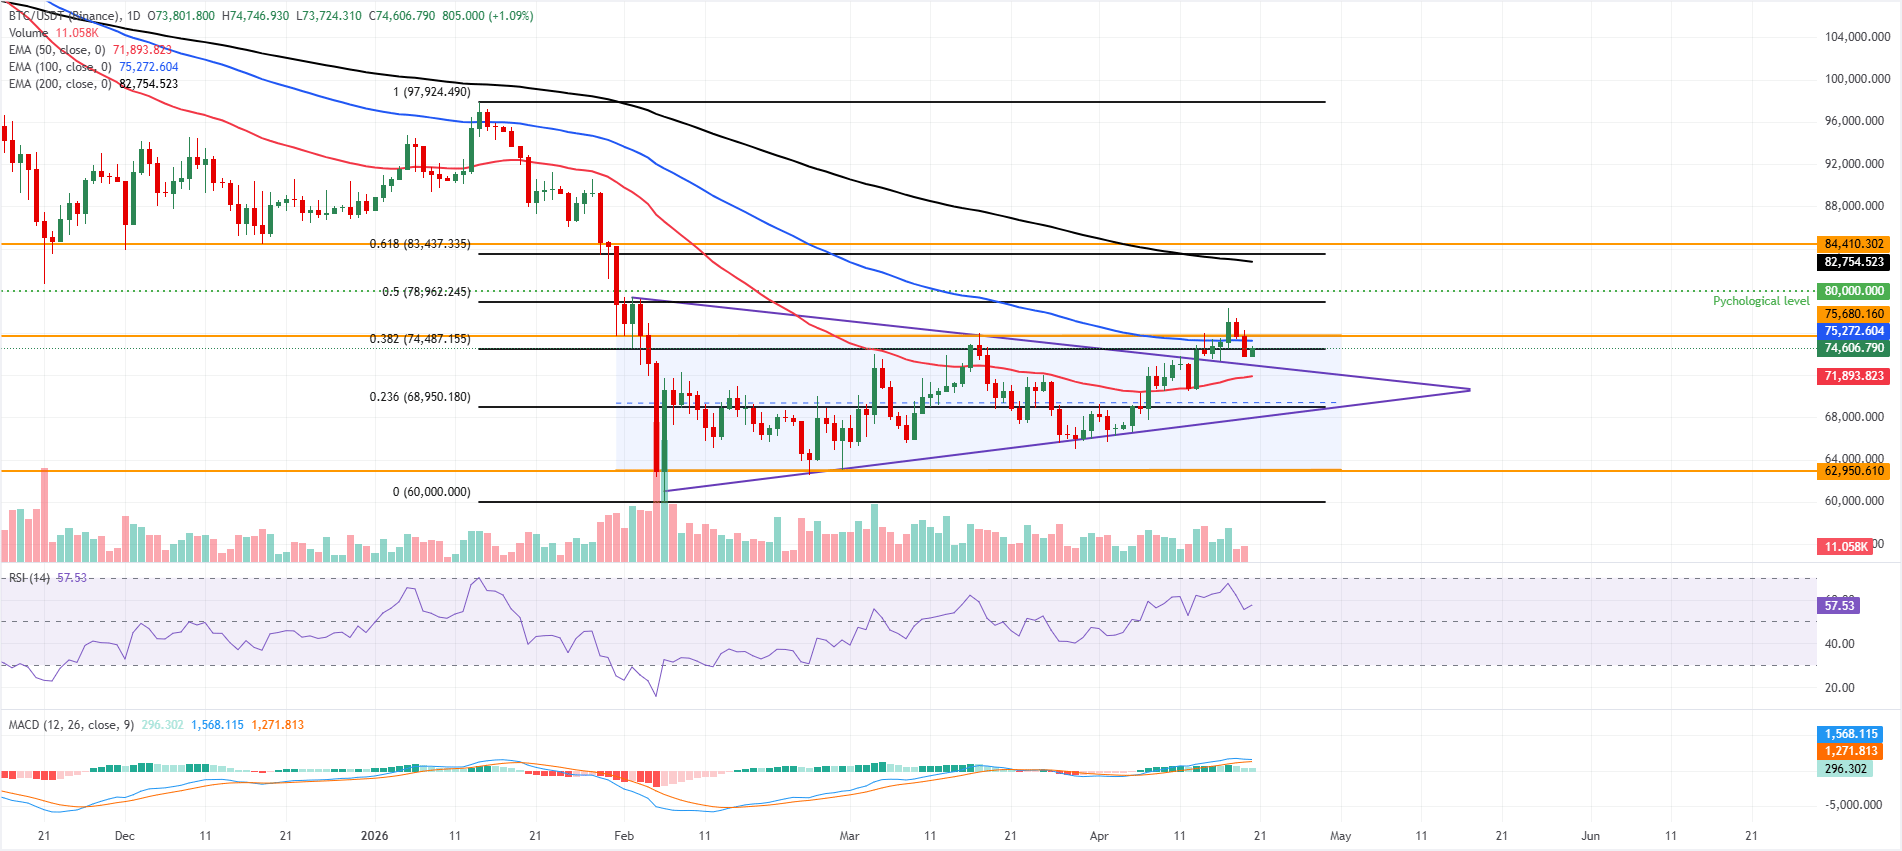
- Bitcoin steadies at $74,500 on Monday after extending its three-week rally.
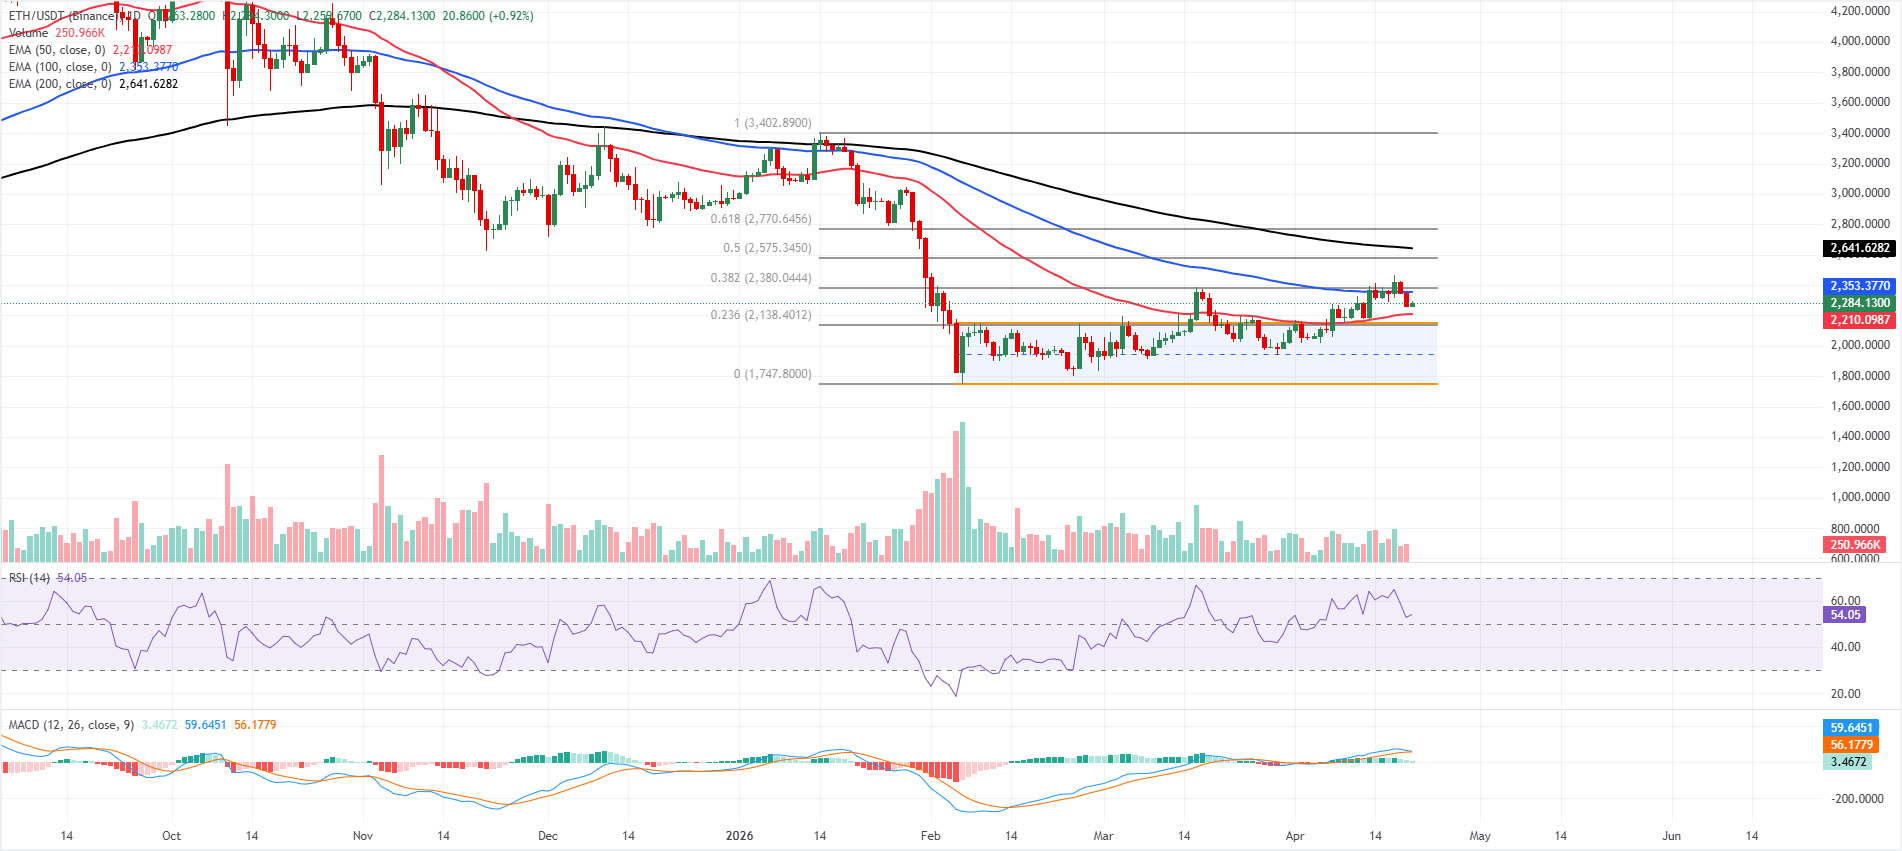
- Ethereum is near the 50-day EMA at $2,210, which holds support for an upside move ahead.
- XRP closed below the key support at $1.41 last week, increasing the risk of further downside pressure if sellers remain in control.
Bitcoin (BTC), Ethereum (ETH) and Ripple (XRP) surged more than 4%, 3% and 5% in the previous week. However, renewed US–Iran tensions over the Strait of Hormuz over the weekend added fresh uncertainty to global risk sentiment, with BTC holding steady around $74,500 on Monday, ETH nears key support and XRP slips below critical support.
Bitcoin holds above the key support zones
Bitcoin price is trading at $74,500 on Monday, after extending its three-week rally. BTC is retaining a bullish near-term bias as price holds above the 50-day Exponential Moving Average (EMA) at $71,893 and has reclaimed the former downtrend resistance line (triangle pattern) around $72,940 as support.
The Crypto King is also stabilizing just over the 38.2% Fibonacci retracement at $74,487, while the Relative Strength Index (RSI) is at 57, and a still-positive Moving Average Convergence Divergence (MACD) line supports ongoing upside pressure, even as the advance starts to slow.
On the topside, immediate resistance is the 100-day EMA near $75,272, with a tighter cap coming from the horizontal barrier at $75,680 and the rising channel top around $75,766; a daily close above this cluster would open the way to the 50% retracement at $78,962 and then the psychological $80,000 level, ahead of the 200-day EMA at $82,754 and the 61.8% retracement near $83,437.
On the downside, initial support is seen at the 38.2% retracement at $74,487, followed by the reclaimed downtrend line around $72,940 and the 50-day EMA at $71,893; deeper pullbacks would expose the 23.6% retracement at $68,950 and the broader support band formed by the prior breakout region around $67,957, before the horizontal floor at $62,950.
Ethereum nears key 50-day EMA
Ethereum price is trading at $2,280 on Monday after surging over 3% in the previous week. ETH is holding a mild bullish bias as price stays above the 50-day EMA at $2,210 and has broken out over the horizontal channel top near $2,148.
The RSI on the daily chart around 54 hints at constructive but not overextended momentum, while the MACD remains marginally positive above the zero line, suggesting upside pressure is intact even as recent histogram behavior points to a moderating impulse.
On the downside, immediate support is aligned with the breakout area between the 50-day EMA at $2,210 and the reclaimed channel boundary at $2,148, ahead of the 23.6% Fibonacci retracement of the broader upswing at $2,138; a break below this cluster would expose the channel floor near $1,747.
On the topside, initial resistance is seen at the 100-day EMA at $2,353, followed by the 38.2% retracement at $2,380, while the 200-day EMA, higher up at $2,641, marks a more strategic barrier that would need to yield to signal a more sustained bullish phase.
XRP slips below the critical support zone
XRP price is trading at $1.40 on Monday, up 5% from the previous week. XRP is holding within a broader downward channel and is capped by a dense layer of EMAs resistance just overhead. XRP price remains below the 50-day EMA at $1.41, while the 100-day EMA at $1.54 and the 200-day EMA at $1.80 sit further above and reinforce a medium-term bearish bias despite the recent bounce.
Momentum has improved, with the RSI on the daily chart hovering near a neutral 53 and the MACD line holding in positive territory, hinting that selling pressure is easing but not yet strong enough to reclaim the key averages.
On the topside, immediate resistance is located at the 50-day EMA near $1.41; a daily close above this level would open the way toward the 100-day EMA at $1.54 and the upper boundary of the descending channel around $1.66, ahead of the more distant horizontal barrier at $1.90.
On the downside, initial support is seen at the horizontal level near $1.30, with a break exposing the channel floor around $0.85, where buyers would be expected to mount a more decisive defense if the broader downtrend resumes.

(The technical analysis of this story was written with the help of an AI tool.)
Cryptocurrency metrics FAQs
The developer or creator of each cryptocurrency decides on the total number of tokens that can be minted or issued. Only a certain number of these assets can be minted by mining, staking or other mechanisms. This is defined by the algorithm of the underlying blockchain technology. On the other hand, circulating supply can also be decreased via actions such as burning tokens, or mistakenly sending assets to addresses of other incompatible blockchains.
Market capitalization is the result of multiplying the circulating supply of a certain asset by the asset’s current market value.
Trading volume refers to the total number of tokens for a specific asset that has been transacted or exchanged between buyers and sellers within set trading hours, for example, 24 hours. It is used to gauge market sentiment, this metric combines all volumes on centralized exchanges and decentralized exchanges. Increasing trading volume often denotes the demand for a certain asset as more people are buying and selling the cryptocurrency.
Funding rates are a concept designed to encourage traders to take positions and ensure perpetual contract prices match spot markets. It defines a mechanism by exchanges to ensure that future prices and index prices periodic payments regularly converge. When the funding rate is positive, the price of the perpetual contract is higher than the mark price. This means traders who are bullish and have opened long positions pay traders who are in short positions. On the other hand, a negative funding rate means perpetual prices are below the mark price, and hence traders with short positions pay traders who have opened long positions.

超過一百萬用戶依賴 FXStreet 獲取即時市場數據、圖表工具、專家洞見與外匯新聞。其全面的經濟日曆與教育網路研討會協助交易者保持資訊領先、做出審慎決策。FXStreet 擁有約 60 人的團隊,分布於巴塞隆納總部及全球各地。
閱讀更多


