
Top Crypto Gainers: Canton, Four, Plasma rally secures double-digit gains
作者 Vishal Dixit
發布日期: 31 Dec 2025 | 修改日期: 31 Dec 2025


熱門文章

Canton (CC), Four (FORM), and Plasma (XPL) are the top-performing crypto assets over the last 24 hours with double-digit gains. The extended recovery in Canton is gaining traction while Four and Plasma target a decisive close above the 200-period Exponential Moving Average (EMA) on the 4-hour chart.
- Canton hovers close to $0.15 after a 17% surge on Tuesday as bullish momentum strengthens.
- Four is up over 3%, extending the 10% gains from the previous day.
- Plasma ticks higher by 4% on Wednesday, marking its ninth consecutive day of recovery.
Canton (CC), Four (FORM), and Plasma (XPL) are the top-performing crypto assets over the last 24 hours with double-digit gains. The extended recovery in Canton is gaining traction while Four and Plasma target a decisive close above the 200-period Exponential Moving Average (EMA) on the 4-hour chart.
Canton gains traction amid bearish RSI divergence
Canton trades in the green at press time on Wednesday, holding the 17% gains from the previous day. The recovery run targets the R1 Pivot Point at $0.1636, which serves as immediate resistance.
If CC clears this level, it could aim for the R2 Pivot Point at $0.1860.
The momentum indicators on the daily chart indicate a bullish bias. The Relative Strength Index (RSI) at 72 resurfaces into the overbought zone after a reversal on Monday. However, RSI signals a bearish divergence as it remains below Monday’s peak, while the CC price hits a new high, suggesting a potential turnaround.
Still, the Moving Average Convergence Divergence (MACD) reinstates an uptrend after crossing above the signal line on Tuesday, indicating renewed bullish momentum.
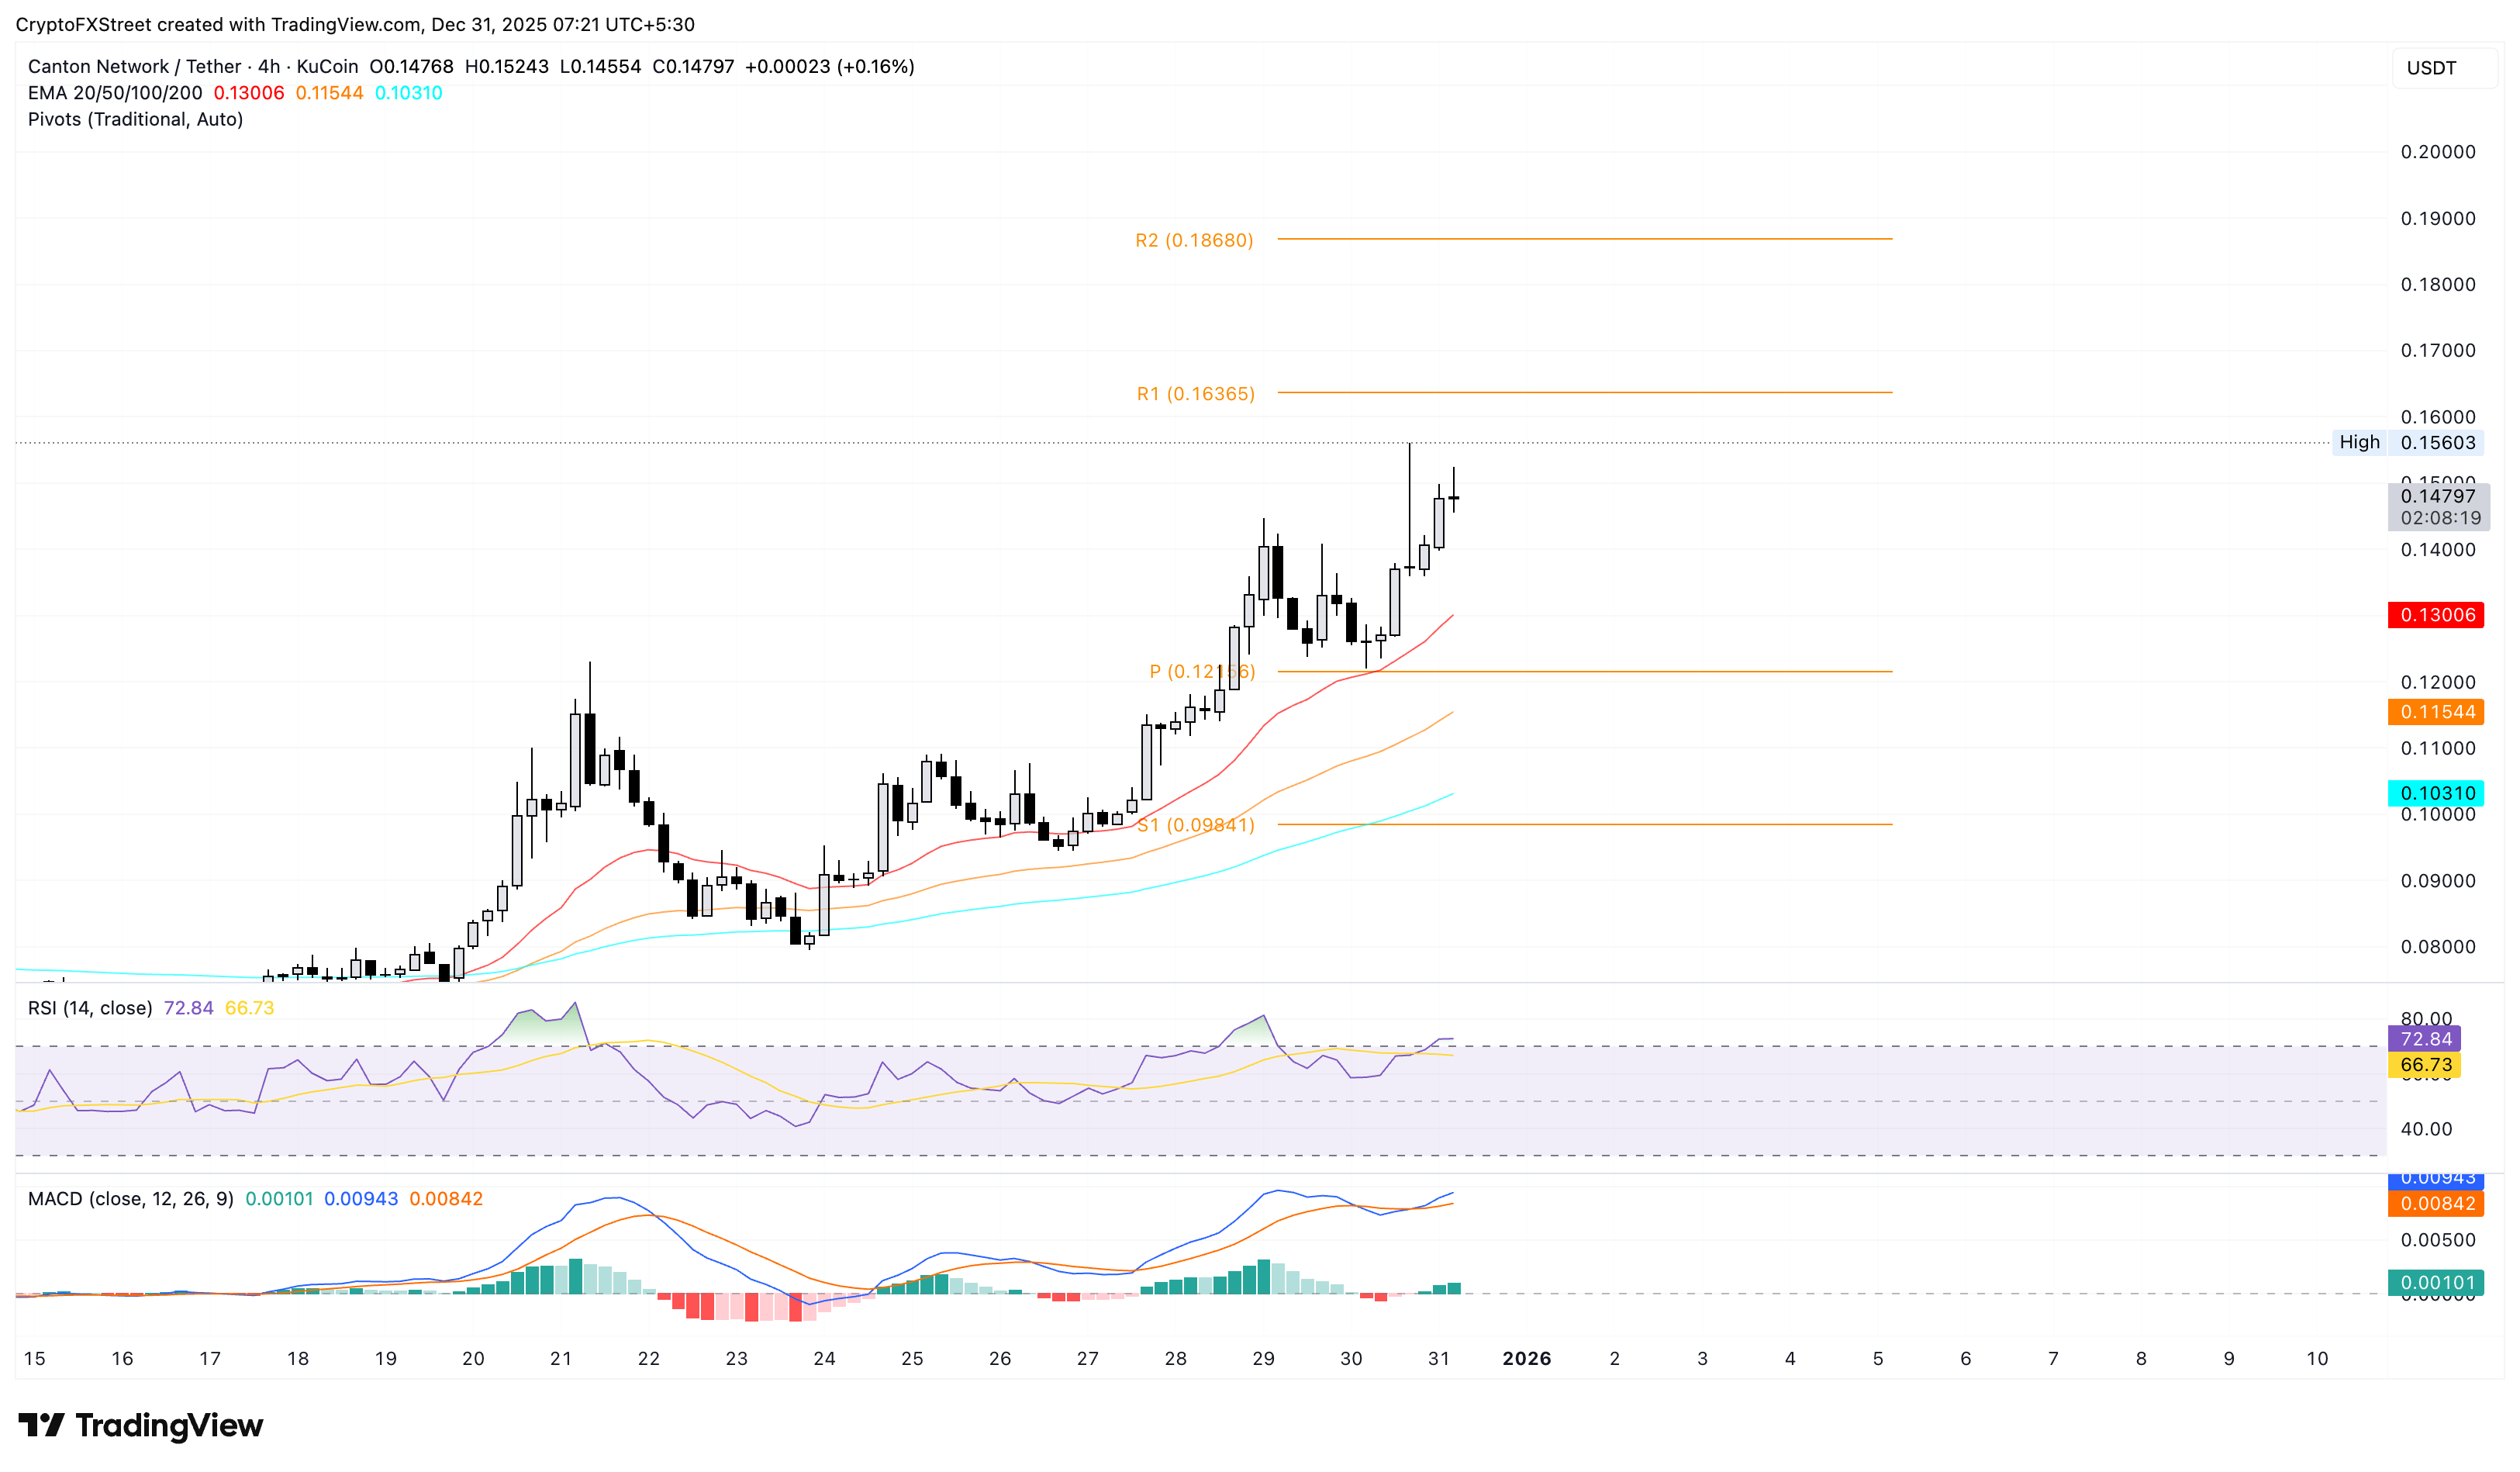
Looking down, a potential reversal in Canton could test the center Pivot Point at $0.1213.
Four struggles to hold above a crucial moving average
Four hovers above the 200-period EMA at $0.3641 on the 4-hour chart, with bulls waiting for a decisive close. At the time of writing, FORM is up over 3% on Wednesday, building on the 10% gains from the previous day.
If FOUR secures a close above $0.3641, it could extend the rally to the R2 Pivot Point at $0.3917.
The RSI at 68 approaches the overbought zone after a rebound from near the oversold zone on Tuesday, suggesting a sudden increase in buying pressure. Meanwhile, the MACD crosses above the zero line after crossing the signal line, indicating a resumption of bullish momentum.
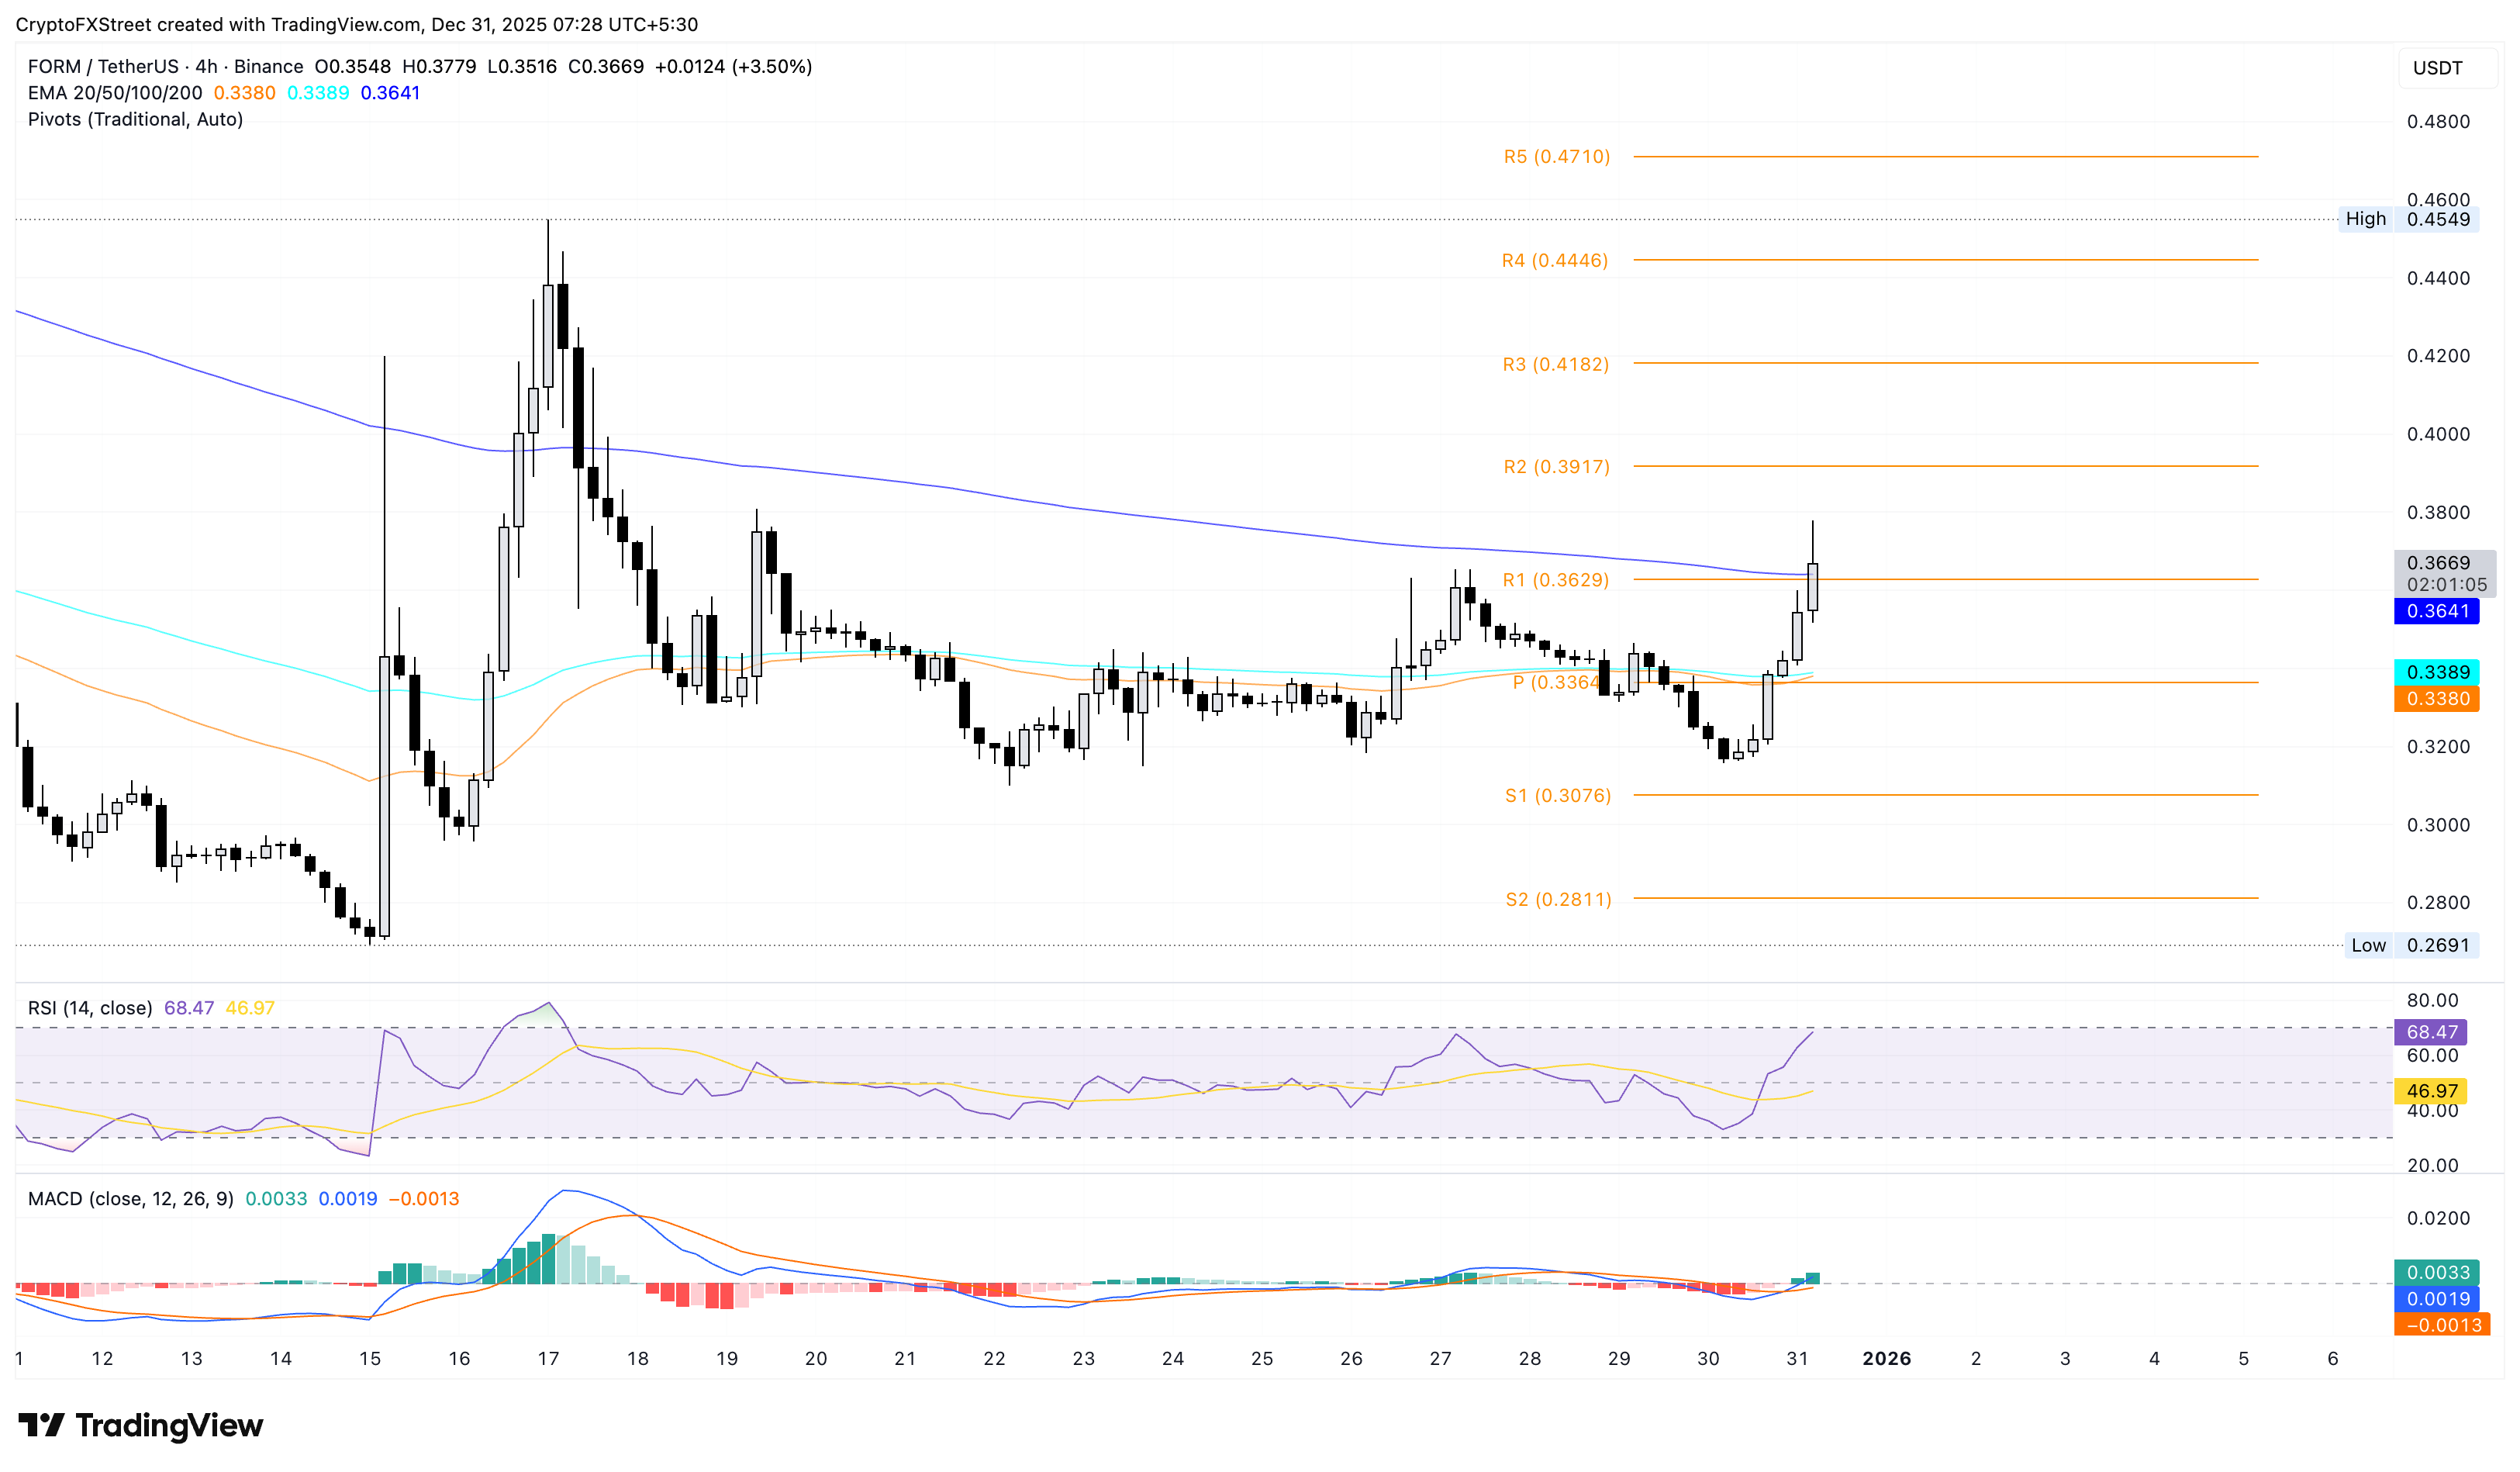
On the flip side, a reversal from $0.3641 could retest the center Pivot Point at $0.3364.
Plasma’s recovery approaches a confluence of resistances
Plasma edges higher by 4% at press time on Wednesday, following a 3.60% increase on the previous day. The XPL token inches closer to the 200-period EMA at $0.1724 on the 4-hour chart, close to the R1 Pivot Point at $0.1730.
If XPL clears this confluence of resistances, it could target the R2 Pivot Point at $0.1904.
The RSI at 67 indicates intense buying pressure, while the MACD converges with the red line, suggesting a potential crossover that would signal renewed bullish momentum and trigger a buy signal.
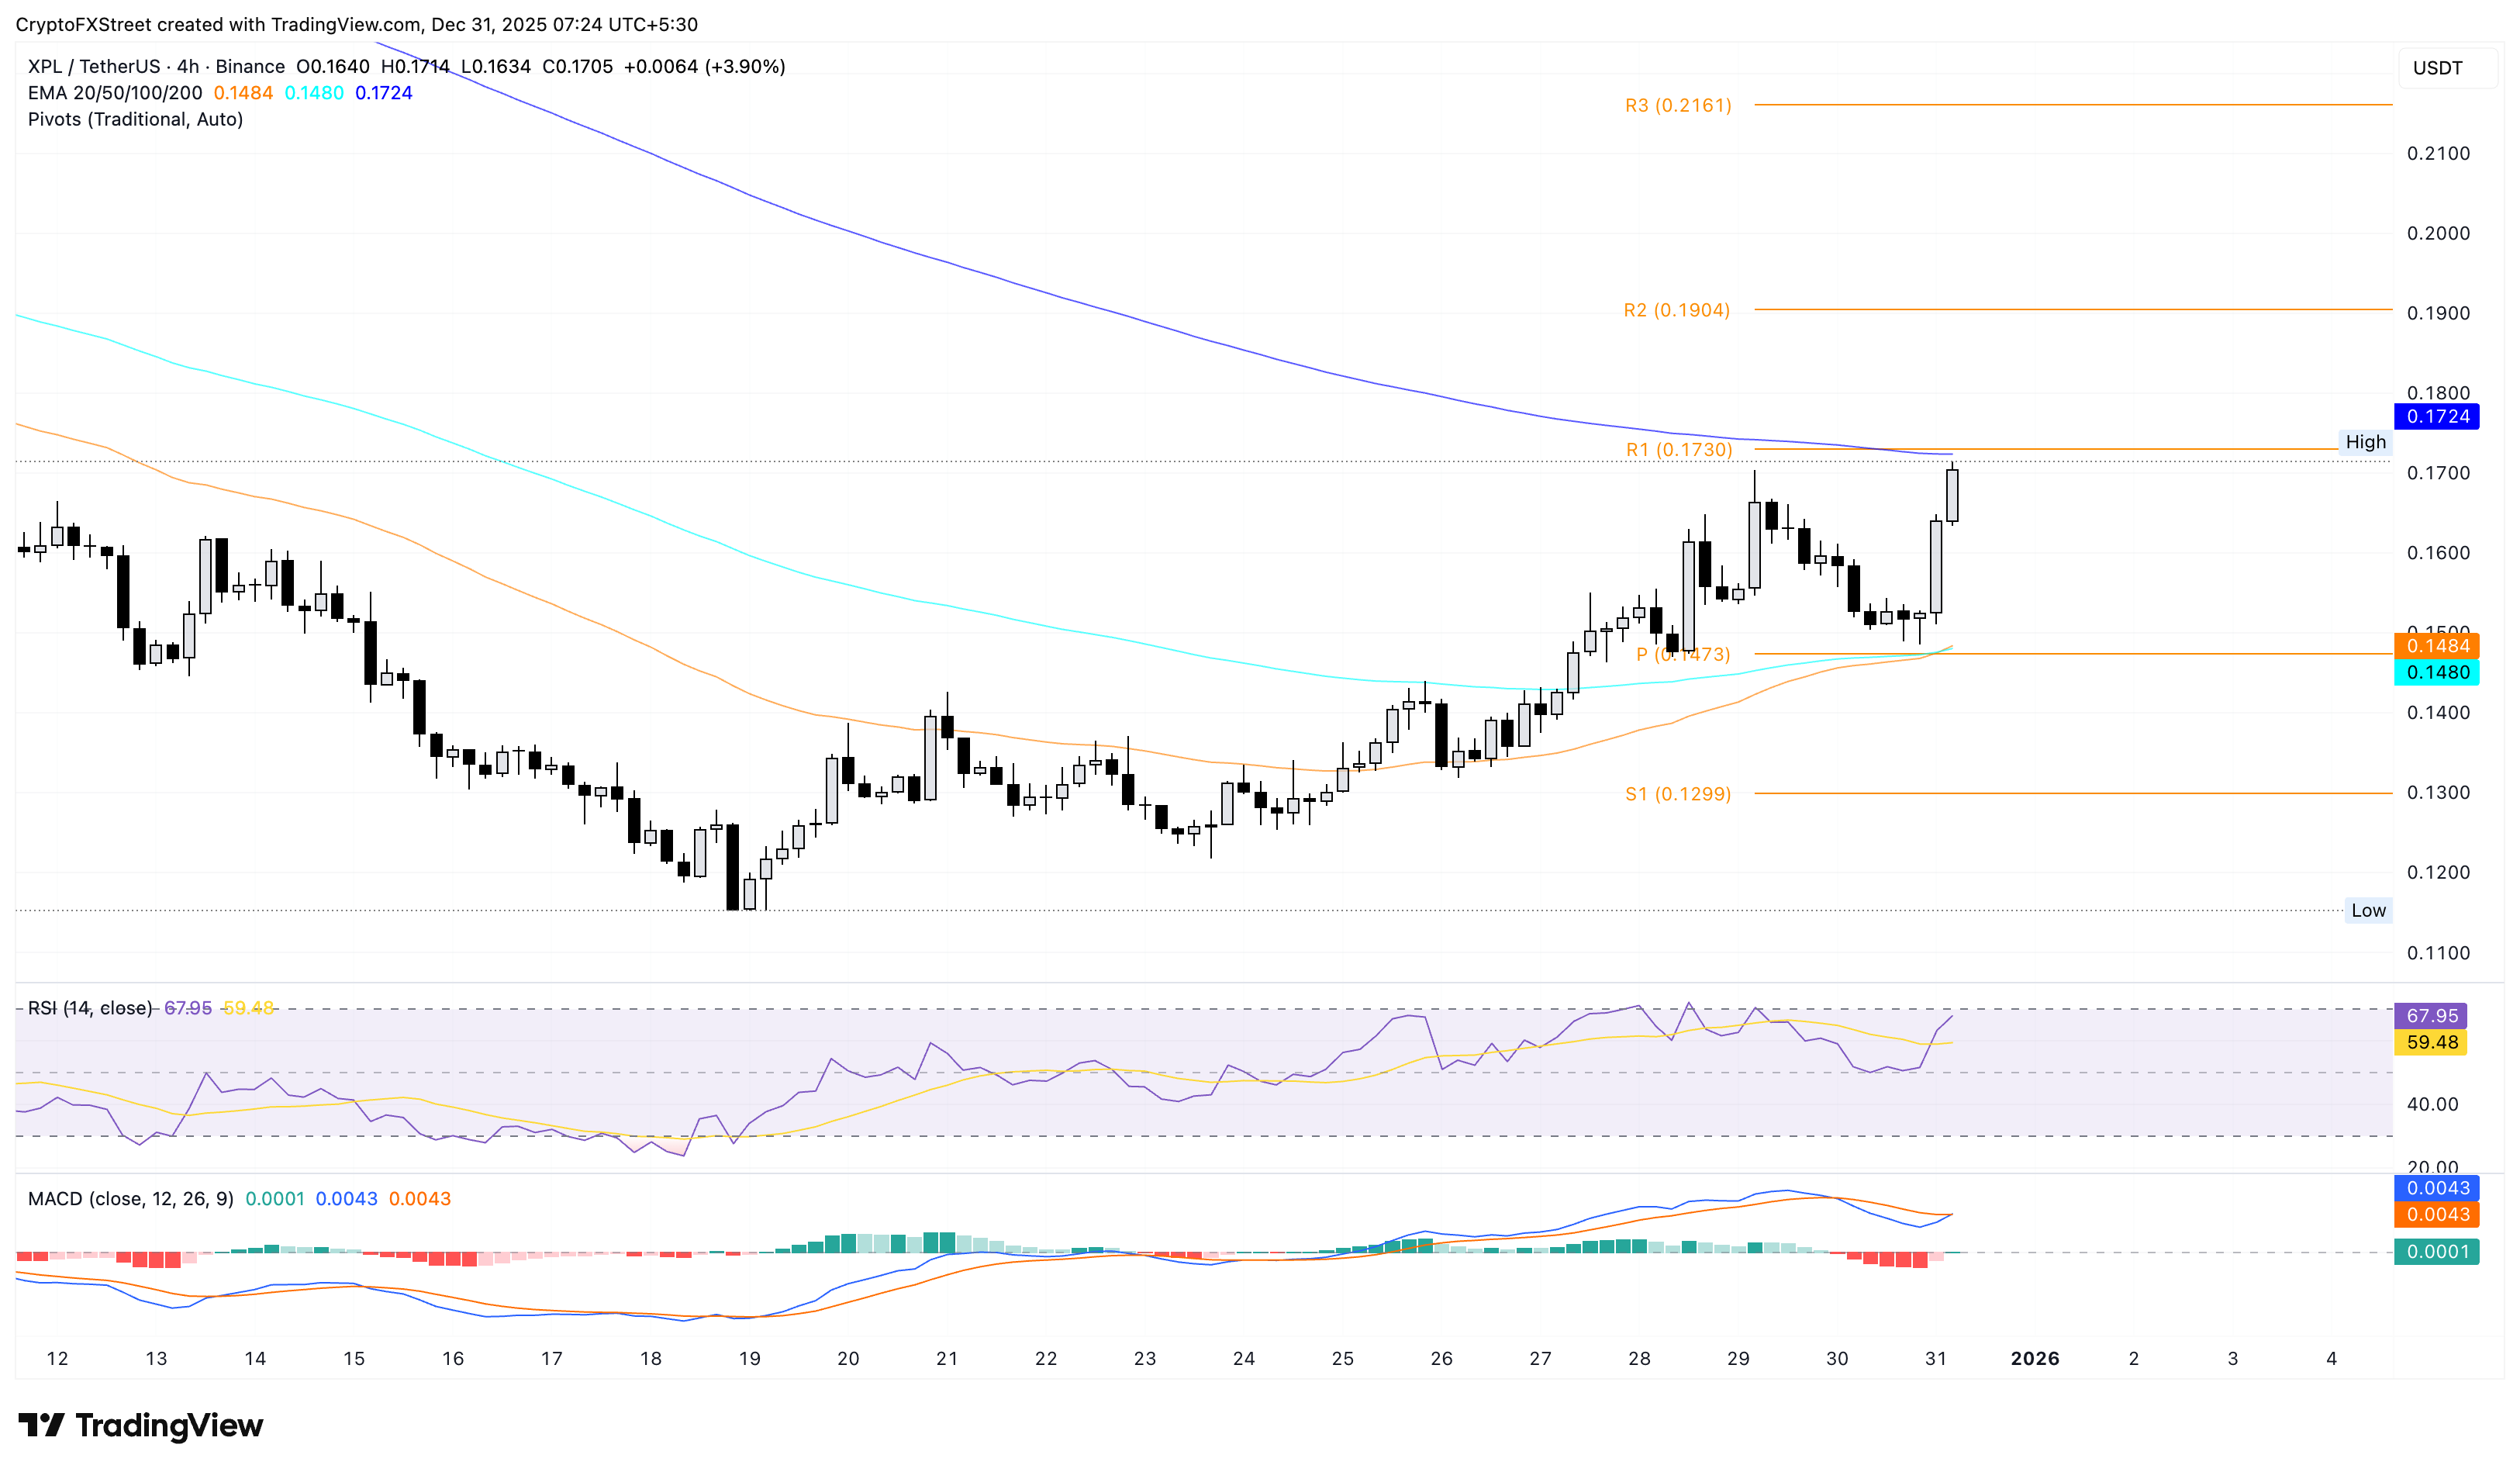
If XPL reverses from $0.1624, it could revisit the center Pivot Point at $0.1473.

超過一百萬用戶依賴 FXStreet 獲取即時市場數據、圖表工具、專家洞見與外匯新聞。其全面的經濟日曆與教育網路研討會協助交易者保持資訊領先、做出審慎決策。FXStreet 擁有約 60 人的團隊,分布於巴塞隆納總部及全球各地。
閱讀更多


