
Uniswap Price Forecast: UNI extends rally amid Arc stablecoin liquidity partnership
作者 John Isige
更新: 16 Jun 2026


熱門文章

Uniswap (UNI) approaches $3.00 at the time of writing on Tuesday, extending its rebound for the sixth consecutive day. The rebound aligns with the broader risk-on mood in the crypto market, with Bitcoin (BTC) trading above $67,000.
- Uniswap extends its recovery near $3.00 as risk-on sentiment broadly improves.
- Uniswap partners with Arc to provide deep stablecoin liquidity and a leading swap infrastructure.
- Bulls target $3.36 as retail interest in UNI derivatives and momentum indicators increase.
Uniswap (UNI) approaches $3.00 at the time of writing on Tuesday, extending its rebound for the sixth consecutive day. The rebound aligns with the broader risk-on mood in the crypto market, with Bitcoin (BTC) trading above $67,000.
Easing geopolitical tensions in the Middle East continue to lift sentiment. The United States (US) and Iran have reportedly signed a virtual peace agreement to end the blockade of Iranian ports, reopen the Strait of Hormuz and start 60 days of nuclear negotiations, according to CNN.
Details of the peace deal are yet to be released, while US President Donald Trump said that the text will be made public following Friday’s signing ceremony.
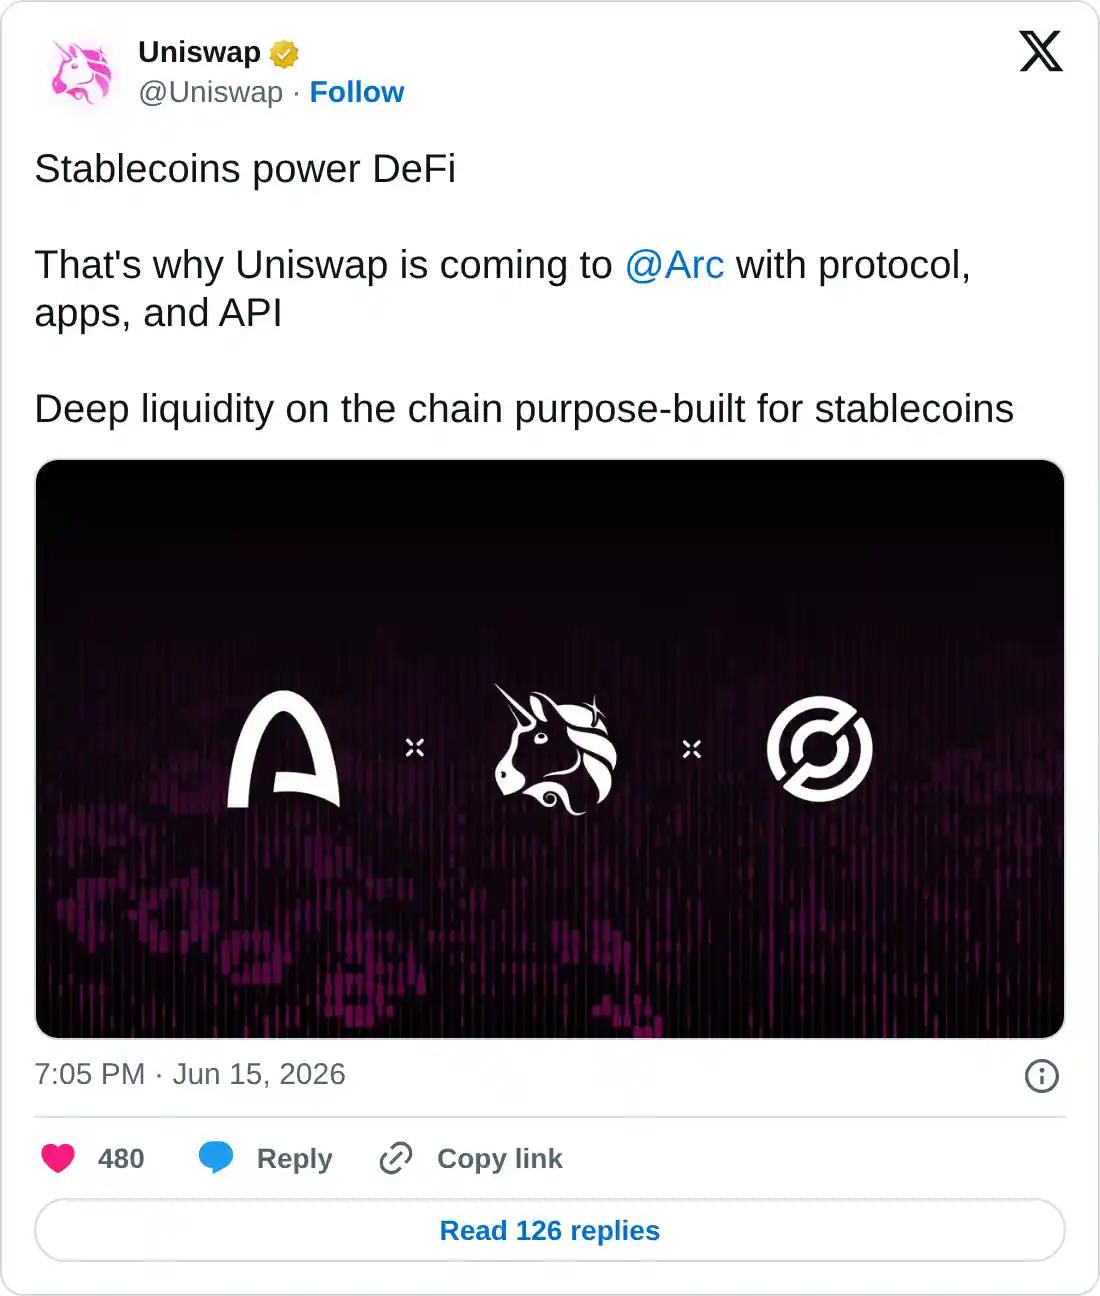
Arc taps Uniswap for stablecoin liquidity
Arc, a platform designed for financial applications, stablecoin flows and Artificial Intelligence (AI)-powered models, has announced a partnership with Uniswap, a decentralized exchange (DEX), to provide stablecoin liquidity.
Uniswap acknowledged the partnership on Monday, stating that it is bringing deep liquidity on the chain purpose-built for stablecoins. The integration ensures that Arc users have access to swap infrastructure backed by over $4.4 trillion in all-time trading volume, along with an Application Programming Interface (API).
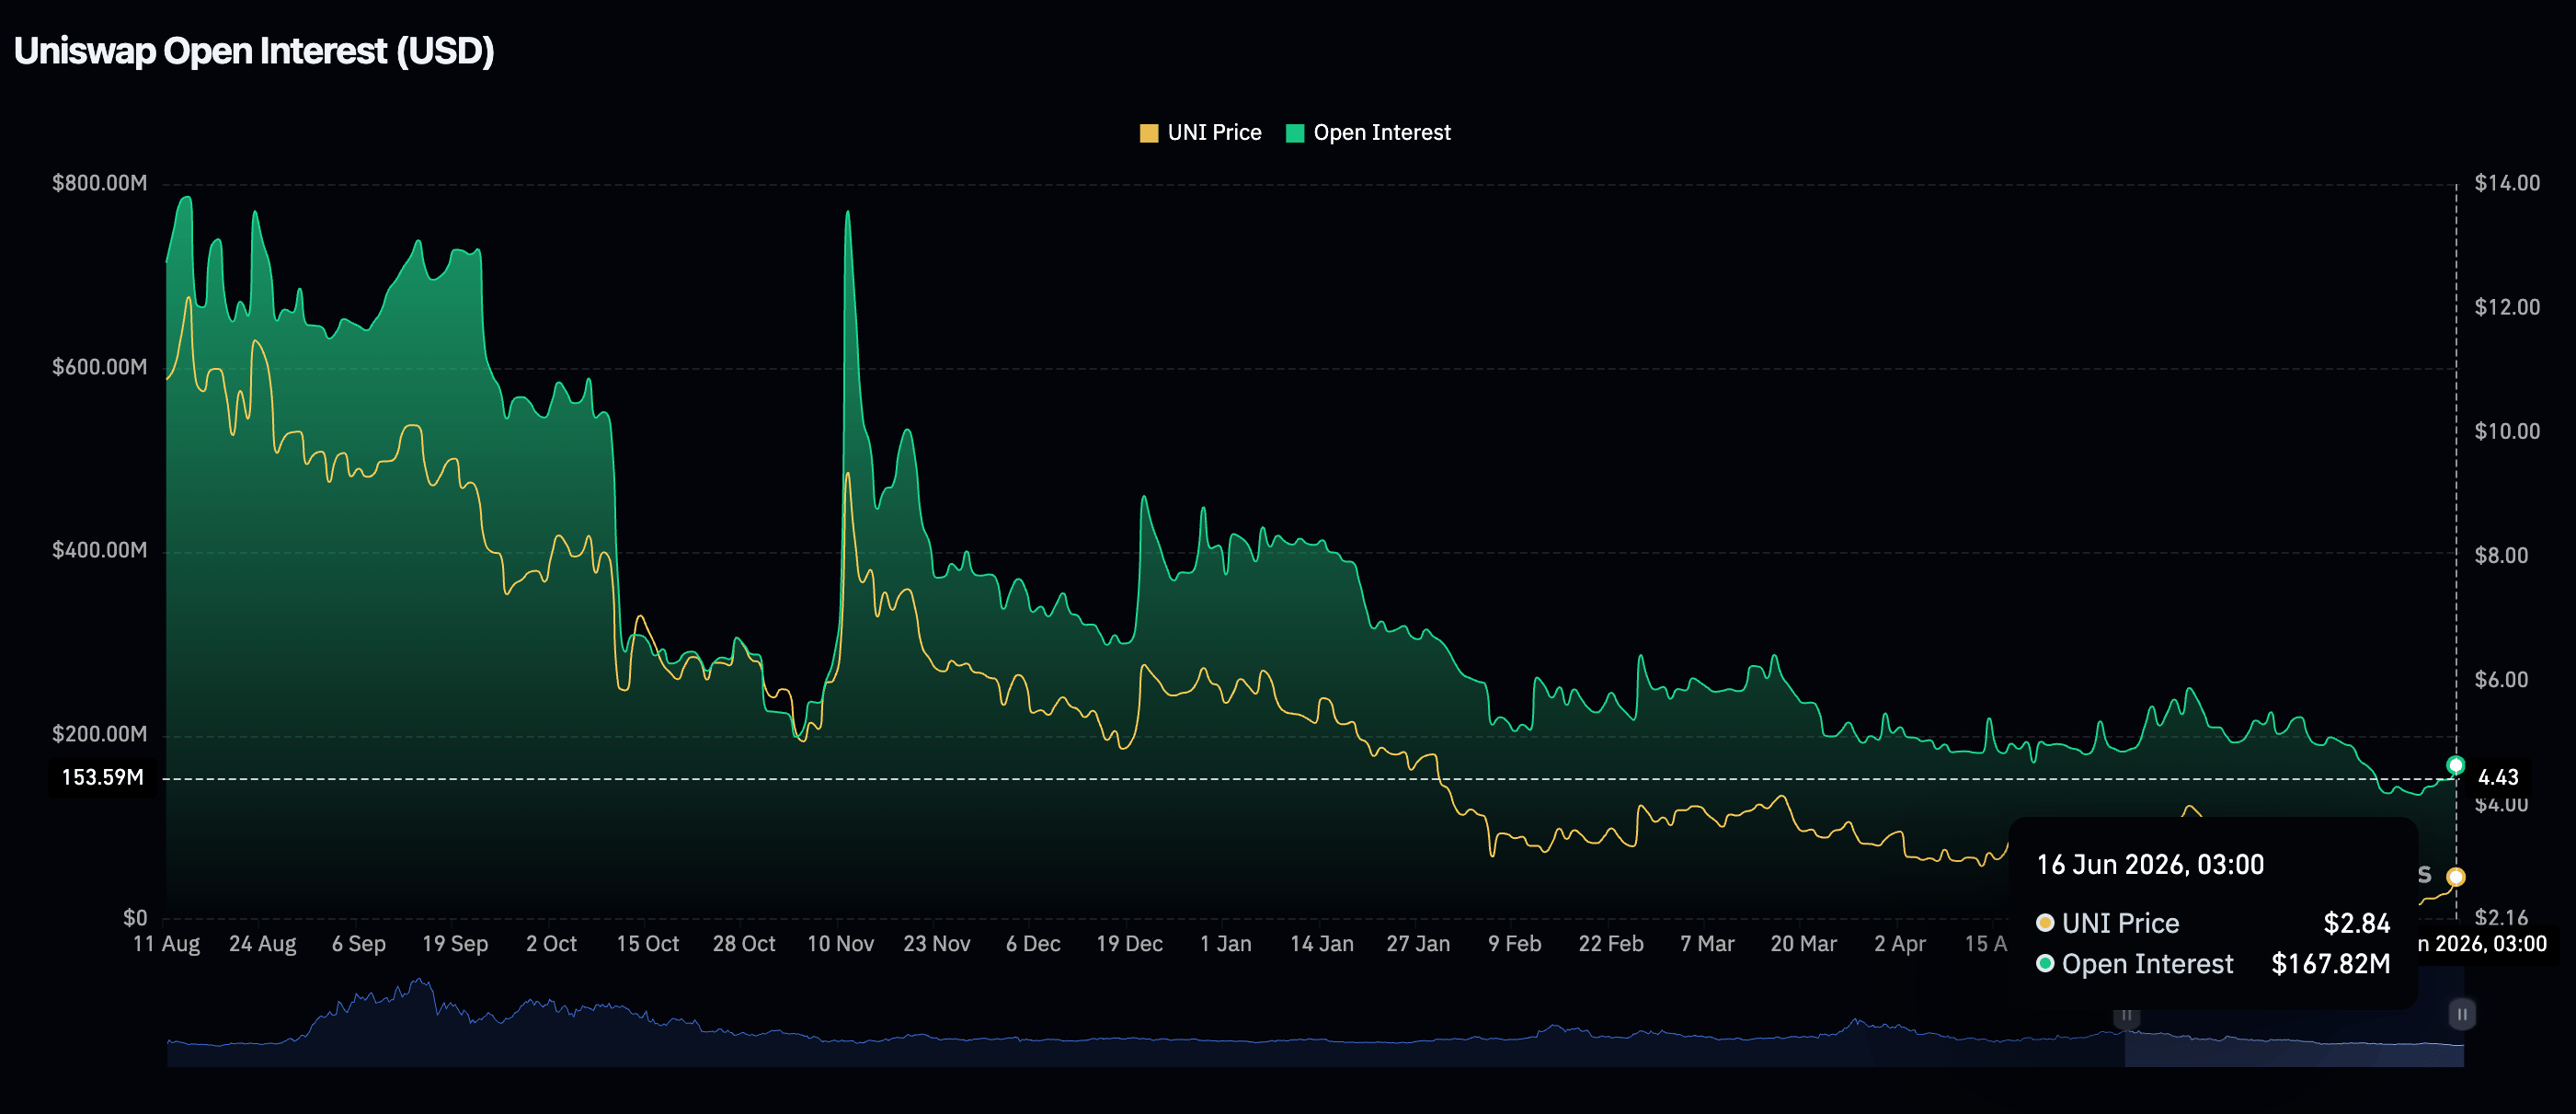
Retail demand for UNI derivatives remains steady, with futures Open Interest (OI) holding near $168 million on Tuesday, up from $152 million the previous day. The OI averaged $135 million on Friday, underscoring the gradual growth in risk-on sentiment. A sustained increase in the OI indicates that investors have confidence in Uniswap’s ability to extend gains in the short to medium term.
Meanwhile, Standard Chartered’s Geoff Kendrick predicted on Monday that Uniswap could rise to reach $6.50 by the end of this year and $100 by 2030. Kendrick based his projection on the growing adoption and demand for tokenization, with Uniswap providing structural support, especially for Wall Street firms.
Kendrick stated that “for TradFi institutions, Uniswap should be viewed less as a retail DEX app and more as market infrastructure that TradFi can integrate with once tokenized assets scale and TradFi operators want to plug them into decentralized finance (DeFi).”
Price analysis: Uniswap technicals fuel recovery
Uniswap trades at $2.94, extending its recovery for the sixth consecutive day. The uptrend built on buy-the-dip demand around June lows at $2.33 and broadly improving sentiment in the crypto market, which aligned with the United States (US) and Iran reaching a peace agreement expected to take effect on Friday. Reports indicate that the two countries have signed a virtual agreement setting the stage for the reopening of the Strait of Hormuz and removing the naval blockade on Iranian ports.
The recent rebound from oversold territory is reflected in the Relative Strength Index (RSI) recovery toward 54 on the daily chart, while the Moving Average Convergence Divergence (MACD) histogram has crossed into positive territory, hinting that downside momentum is fading even as the broader downtrend and descending resistance line remain dominant.
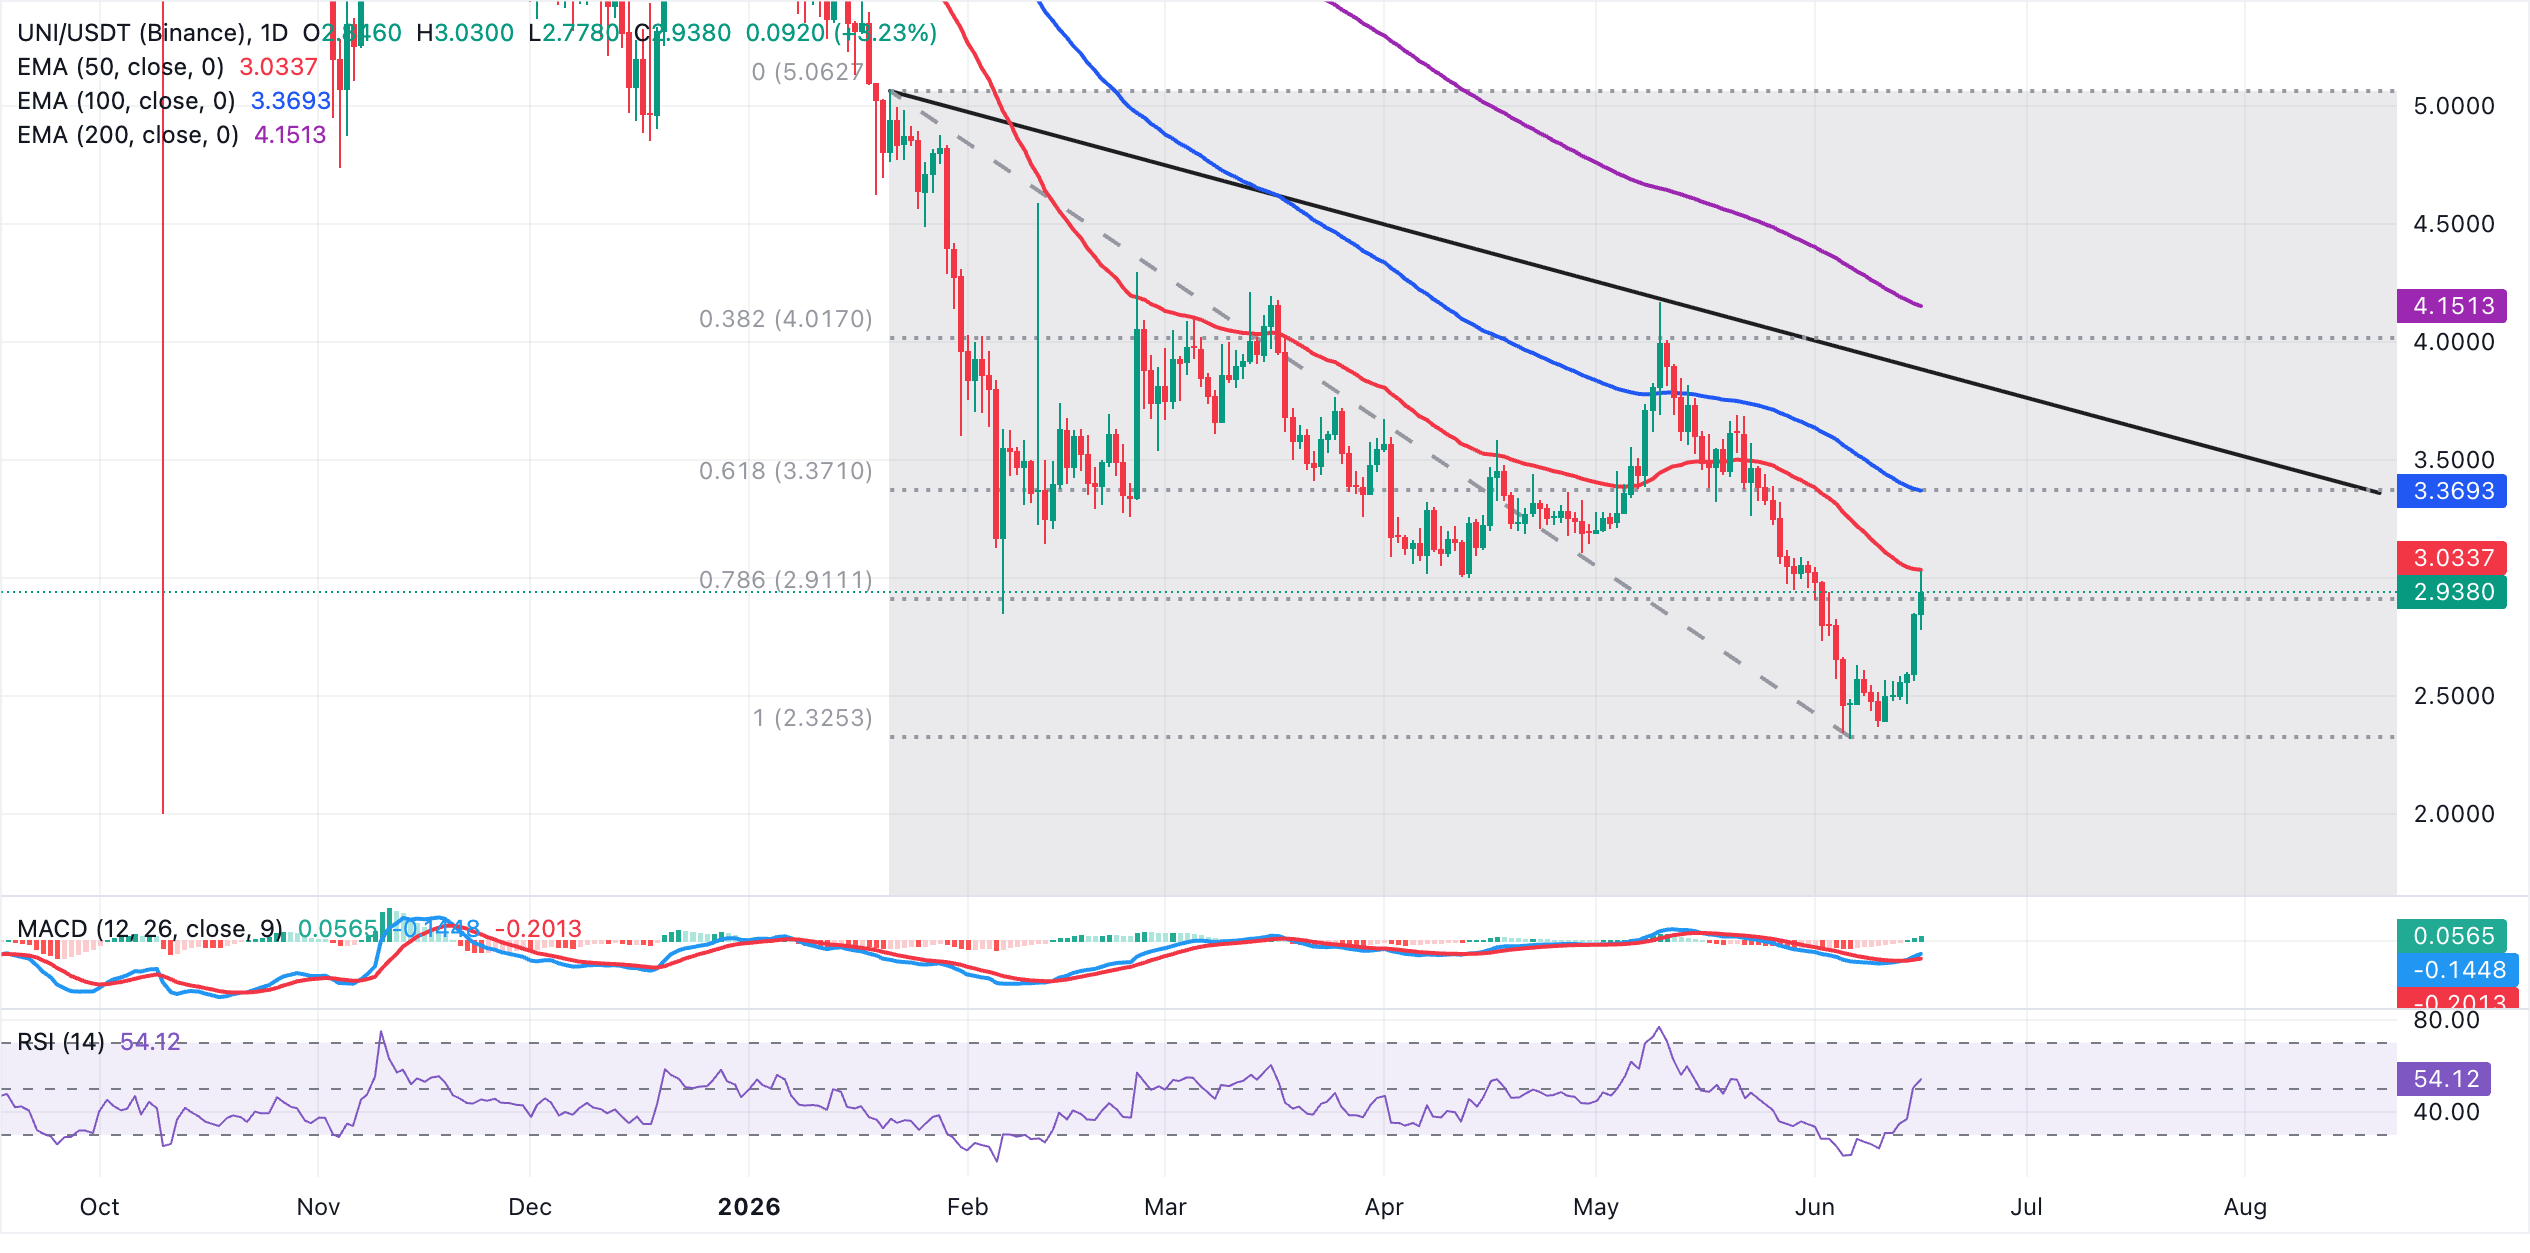
On the downside, initial support is seen at the 78.6% Fibonacci retracement at roughly $2.91, with a deeper floor near the prior cycle low around the 100% Fibonacci retracement at $2.33. On the topside, immediate resistance aligns at the 50-day Exponential Moving Average (EMA) at $3.03, followed by a dense confluence between the 100-day EMA and the 61.8% Fibonacci level at $3.37. Extended gains would face successive barriers at the 50% Fibonacci retracement at $3.69 and the broken descending trendline region near $3.88.
(The technical analysis of this story was written with the help of an AI tool.)
Open Interest, funding rate FAQs
Higher Open Interest is associated with higher liquidity and new capital inflow to the market. This is considered the equivalent of increase in efficiency and the ongoing trend continues. When Open Interest decreases, it is considered a sign of liquidation in the market, investors are leaving and the overall demand for an asset is on a decline, fueling a bearish sentiment among investors.
Funding fees bridge the difference between spot prices and prices of futures contracts of an asset by increasing liquidation risks faced by traders. A consistently high and positive funding rate implies there is a bullish sentiment among market participants and there is an expectation of a price hike. A consistently negative funding rate for an asset implies a bearish sentiment, indicating that traders expect the cryptocurrency’s price to fall and a bearish trend reversal is likely to occur.

超過一百萬用戶依賴 FXStreet 獲取即時市場數據、圖表工具、專家洞見與外匯新聞。其全面的經濟日曆與教育網路研討會協助交易者保持資訊領先、做出審慎決策。FXStreet 擁有約 60 人的團隊,分布於巴塞隆納總部及全球各地。
閱讀更多


