
USD/JPY Price Forecast: Remains above 159.50 amid persistent bullish bias
作者 Akhtar Faruqui
發布日期: 16 Mar 2026 | 修改日期: 16 Mar 2026


熱門文章

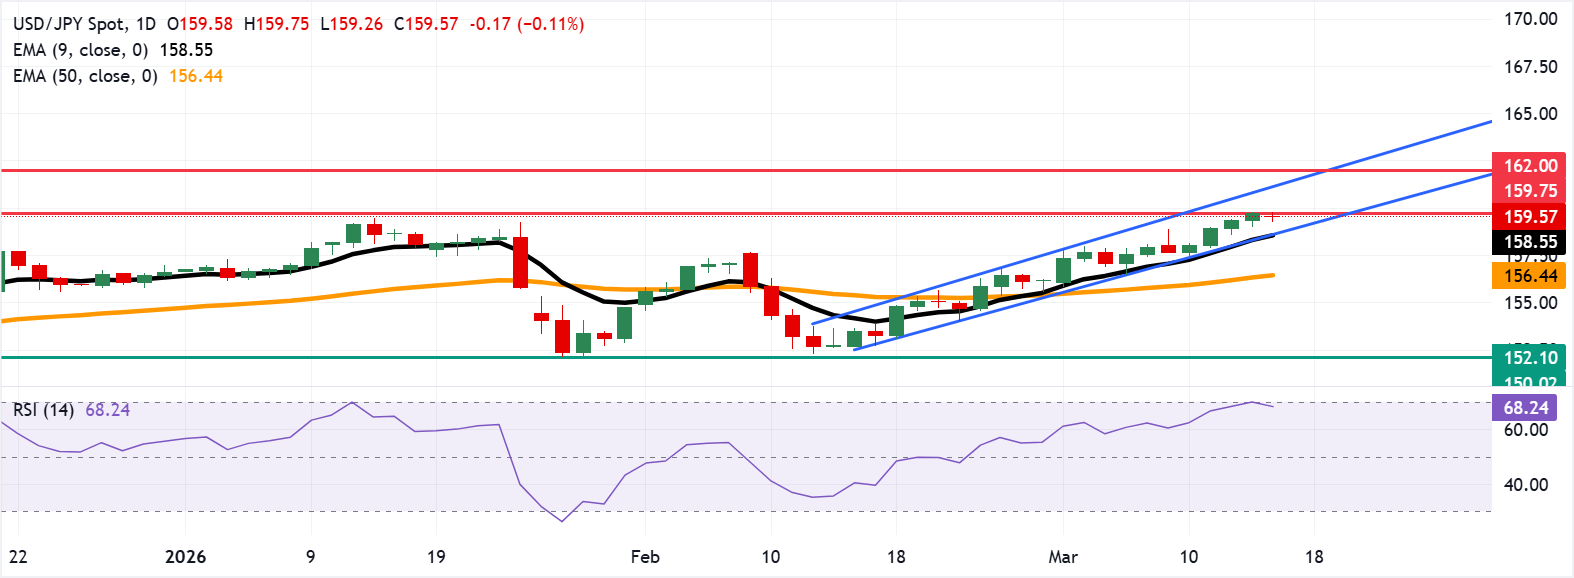
USD/JPY edges lower after four days of losses, trading around 159.60 during the Asian hours on Monday. On the daily chart, technical analysis indicates a persistent bullish bias as the pair remains within the ascending channel pattern.
- The USD/JPY pair tests 159.75, its highest level since July 2024.
- The 14-day Relative Strength Index sits in the high 60s, signaling strong upside momentum.
- Initial support appears at the nine-day EMA near 158.55, aligning with the ascending channel’s lower boundary.
USD/JPY edges lower after four days of losses, trading around 159.60 during the Asian hours on Monday. On the daily chart, technical analysis indicates a persistent bullish bias as the pair remains within the ascending channel pattern.
The near-term bias is bullish as the USD/JPY pair holds well above the rising 50-day Exponential Moving Average (EMA) and extends the rebound that followed the mid-month pullback. The nine-day EMA tracks just below spot and has reasserted itself as dynamic support, underscoring persistent buying interest on shallow dips. The 14-day Relative Strength Index (RSI) sits in the high 60s, confirming strong upside momentum without yet registering extreme overbought conditions.
The USD/JPY pair tests the 159.75, the highest since July 2024, reached on March 13, followed by the upper boundary of the ascending channel around 161.30. A break above the channel would lead the pair to hit the all-time high of 162.00, recorded in July 2024.
The initial support lies at the lower boundary of the ascending channel at the nine-day EMA at 158.55. Further declines below this confluence support zone would weaken short-term price momentum and expose the medium-term average at 156.44.
(The technical analysis of this story was written with the help of an AI tool.)
Japanese Yen Price Today
The table below shows the percentage change of Japanese Yen (JPY) against listed major currencies today. Japanese Yen was the strongest against the US Dollar.
| USD | EUR | GBP | JPY | CAD | AUD | NZD | CHF | |
|---|---|---|---|---|---|---|---|---|
| USD | -0.28% | -0.24% | -0.08% | -0.05% | -0.39% | -0.69% | -0.28% | |
| EUR | 0.28% | 0.12% | 0.22% | 0.24% | -0.11% | -0.28% | 0.00% | |
| GBP | 0.24% | -0.12% | 0.17% | 0.12% | -0.23% | -0.43% | -0.07% | |
| JPY | 0.08% | -0.22% | -0.17% | 0.06% | -0.30% | -0.43% | -0.19% | |
| CAD | 0.05% | -0.24% | -0.12% | -0.06% | -0.34% | -0.55% | -0.19% | |
| AUD | 0.39% | 0.11% | 0.23% | 0.30% | 0.34% | -0.20% | 0.23% | |
| NZD | 0.69% | 0.28% | 0.43% | 0.43% | 0.55% | 0.20% | 0.36% | |
| CHF | 0.28% | -0.00% | 0.07% | 0.19% | 0.19% | -0.23% | -0.36% |
The heat map shows percentage changes of major currencies against each other. The base currency is picked from the left column, while the quote currency is picked from the top row. For example, if you pick the Japanese Yen from the left column and move along the horizontal line to the US Dollar, the percentage change displayed in the box will represent JPY (base)/USD (quote).

超過一百萬用戶依賴 FXStreet 獲取即時市場數據、圖表工具、專家洞見與外匯新聞。其全面的經濟日曆與教育網路研討會協助交易者保持資訊領先、做出審慎決策。FXStreet 擁有約 60 人的團隊,分布於巴塞隆納總部及全球各地。
閱讀更多


