
Trade The World
Bitcoin Cash Price Forecast: Downside risk grows as open interest, whale holding declines
作者 Vishal Dixit
發布日期: 24 Sep 2025 | 修改日期: 24 Sep 2025


POPULAR ARTICLES

Bitcoin Cash (BCH) recovers 1% at press time on Wednesday as the broader market stabilizes after a turbulent start to the week. Still, both the derivatives data and the technical outlook suggest that the downside risk could persist based on declining open interest and a pattern breakdown.
- Bitcoin Cash slips out of an expanding channel pattern on the daily chart.
- The BCH open interest drop signals a decrease in demand among derivative traders.
- Retail demand remains strong for BCH as whales' buying pressure weakens.
Bitcoin Cash (BCH) recovers 1% at press time on Wednesday as the broader market stabilizes after a turbulent start to the week. Still, both the derivatives data and the technical outlook suggest that the downside risk could persist based on declining open interest and a pattern breakdown. Furthermore, the large wallet investors, popularly known as whales, are offloading BCH while retail investors accumulate, anticipating a bounce back.
Derivatives and on-chain data indicate downside risk persists
Santiment data shows a drift developing between retail and large wallet investors based on the Bitcoin Cash supply distribution. Investors with less than 10,000 BCH continue the accumulation spree, reaching a total holding of 11.27 million BCH.
On the other hand, large investors with 10,000 to 1 million tokens have trimmed their holdings to 8.71 million BCH, from the year-to-date high of 9 million BCH on April 9. Typically, the trading activity of whales is a trend-deciding factor, which in this case could result in heightened selling pressure.
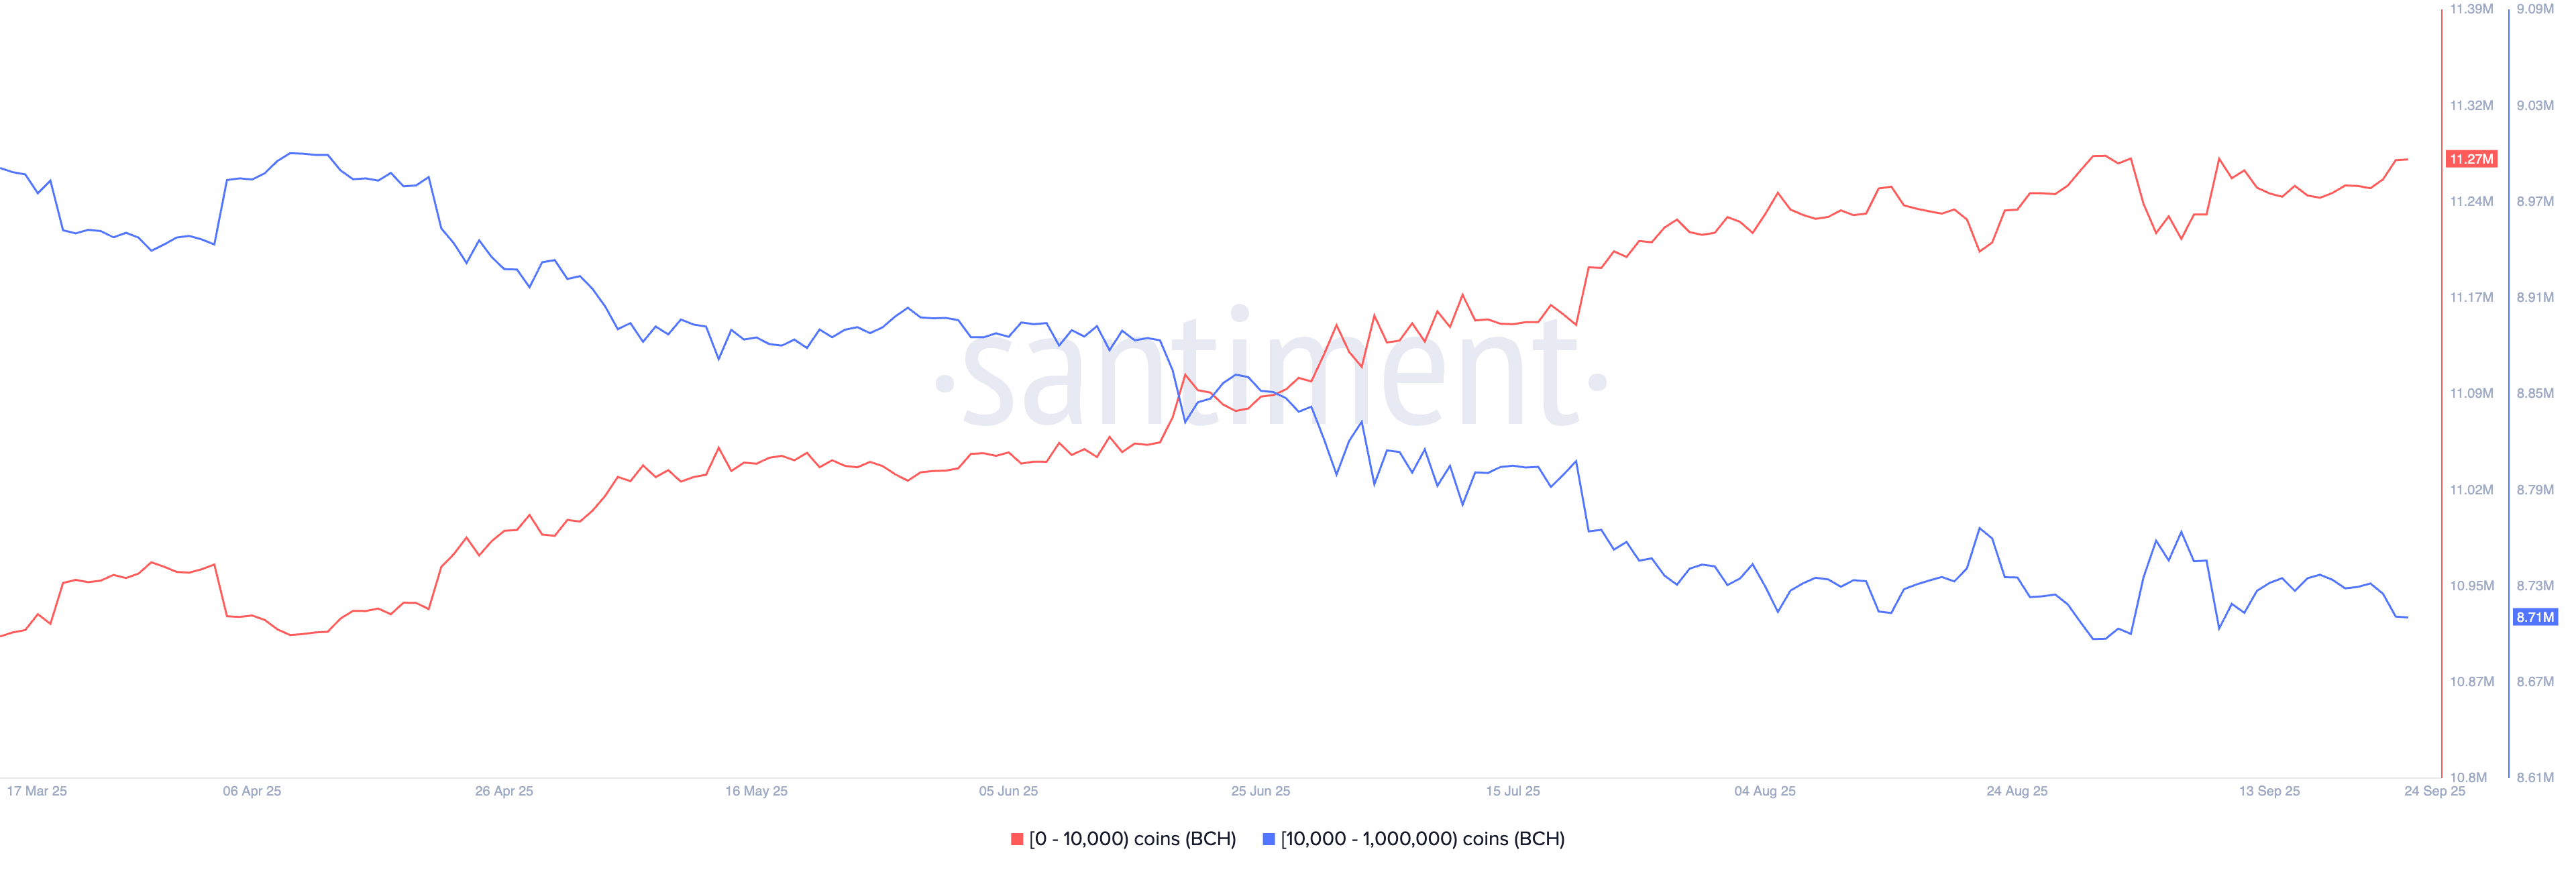
Bitcoin Cash supply distribution. Source: Santiment
Adding to the downside, CoinGlass data reveals that the Bitcoin Cash Open Interest (OI) has declined by 2.16% in the last 24 hours, reaching $432.79 million. This significant capital outflow from BCH derivatives suggests that traders are exiting either due to forced liquidation or a decline in confidence.
The 24-hour liquidation data shows a bearish incline as long liquidations at $313,580 outpace the short liquidations of $33,450. This indicates that a greater number of bullish-aligned positions were wiped out in the last 24 hours.
Finally, the OI-weighted funding rate has decreased to 0.0019% at press time on Wednesday, from the intraday peak of 0.0071%, indicating a decline in bullish trading activity.
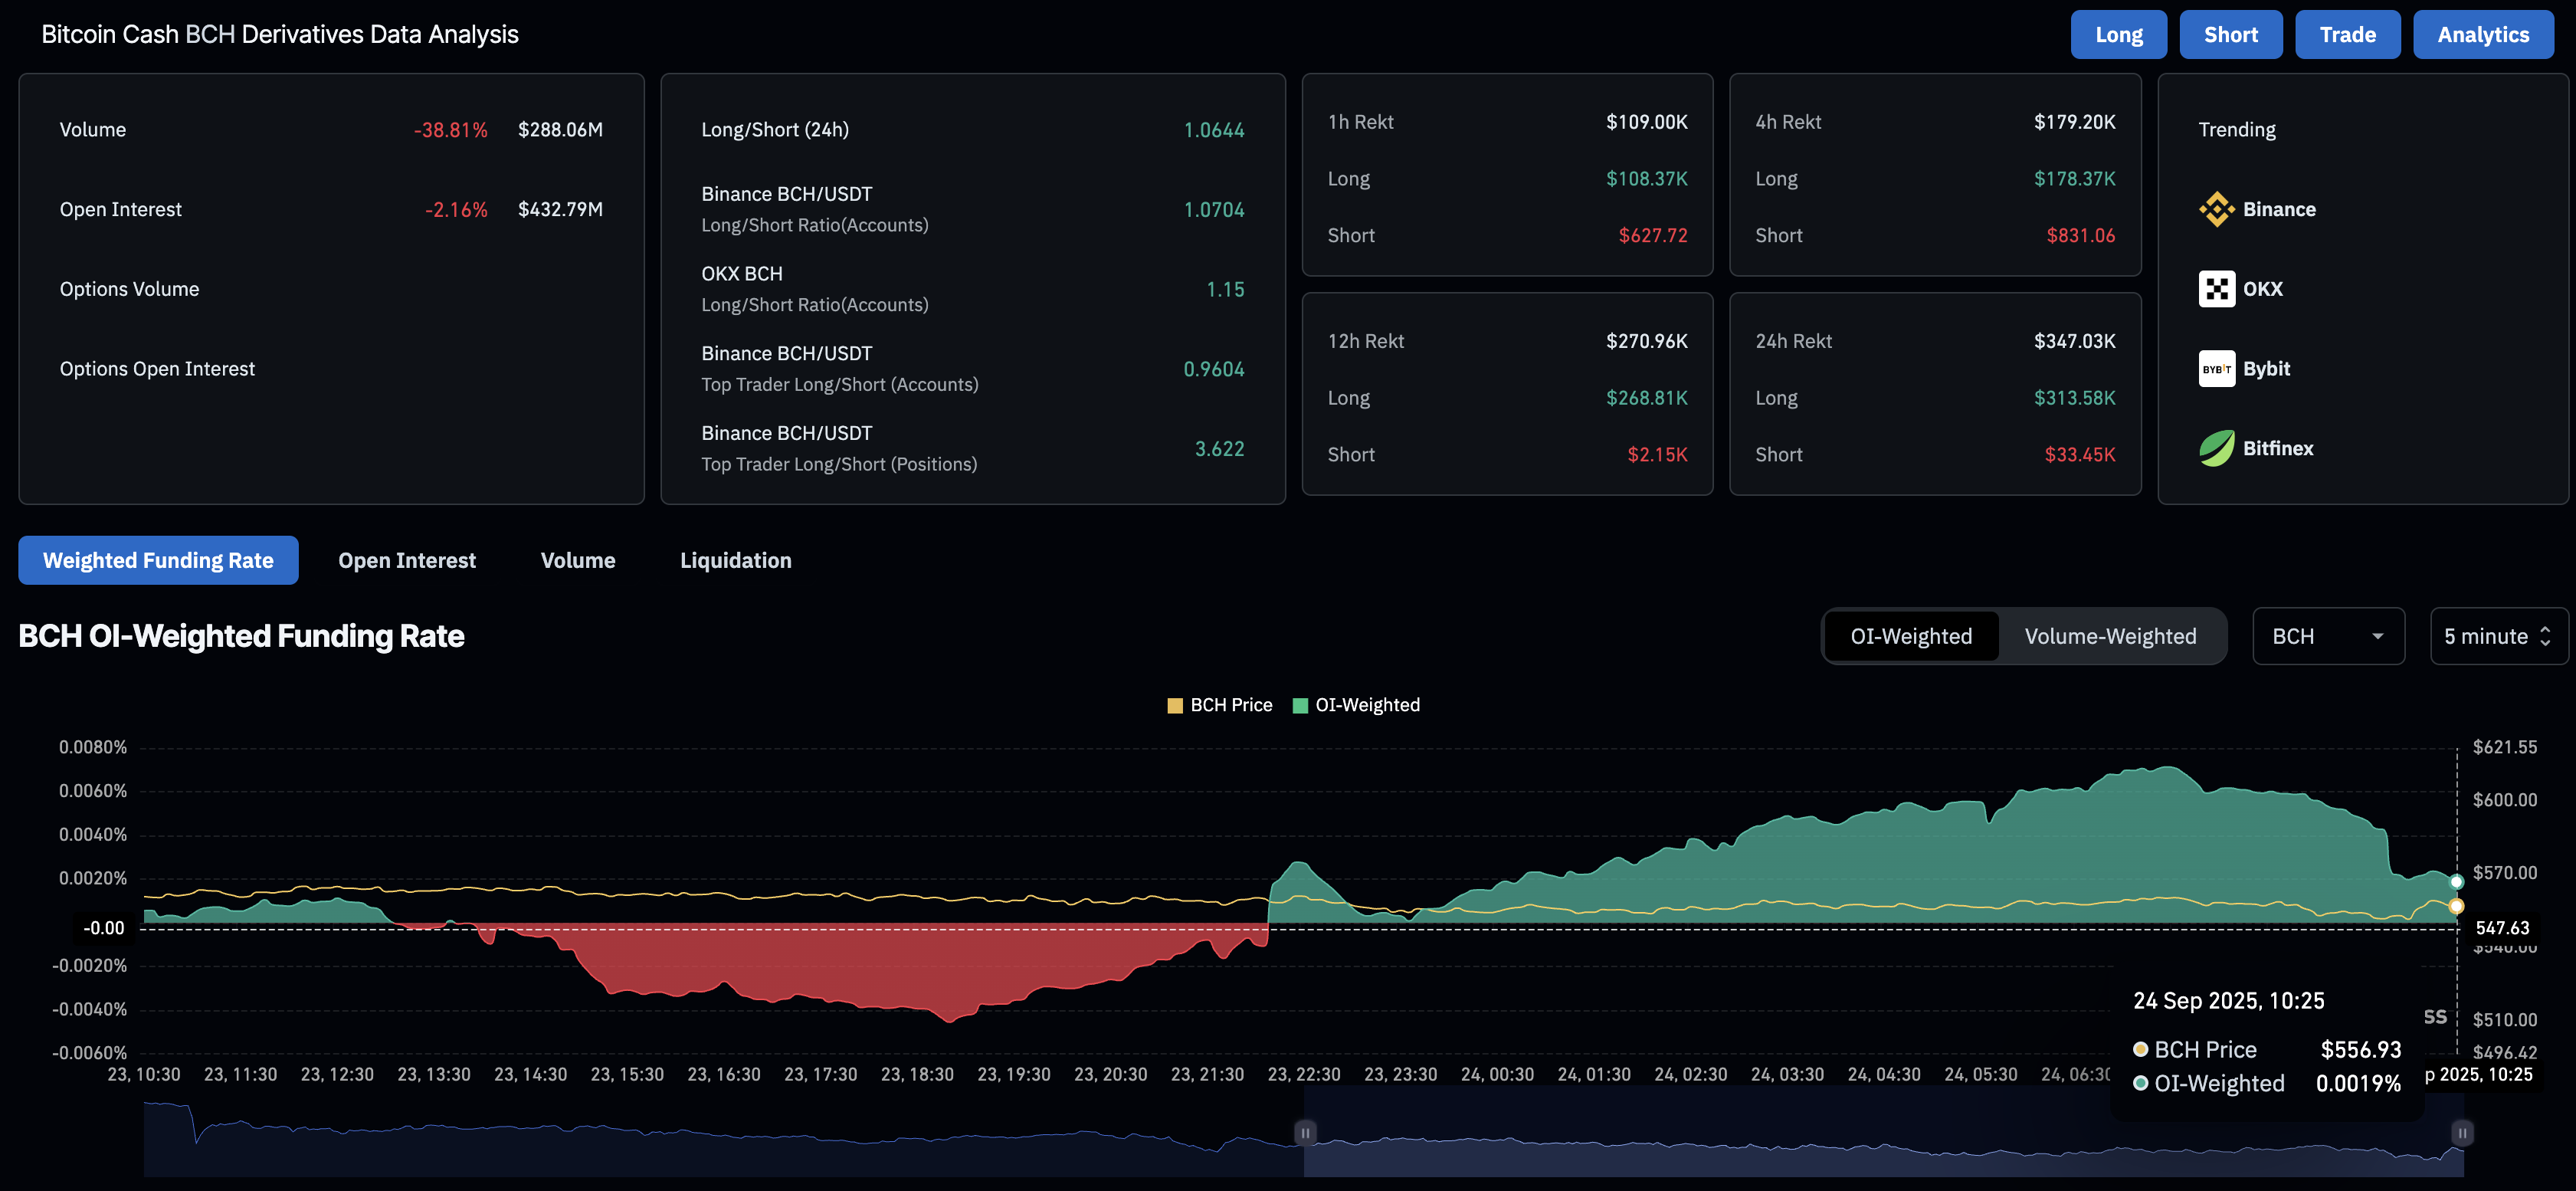
Bitcoin Cash derivatives. Source: CoinGlass
Bitcoin Cash risks losing the $500 milestone
Bitcoin Cash holds above the 100-period Exponential Moving Average (EMA) at $541, rising after five days of downtrend and breaking down an expanding channel on the daily chart. Despite the short-term rise, momentum indicators on the same chart reflect that the bearish momentum remains prominent.
The Relative Strength Index (RSI) at 42 remains below the midpoint, indicating further room for correction. Additionally, the Moving Average Convergence Divergence (MACD) indicator hits the zero line after crossing below its signal line on Sunday. A successive rise in the red histogram bars indicates increasing bearish momentum.
If BCH marks a decisive close below the 100-day EMA at $541, it could extend the decline to the 200-day EMA at $493.
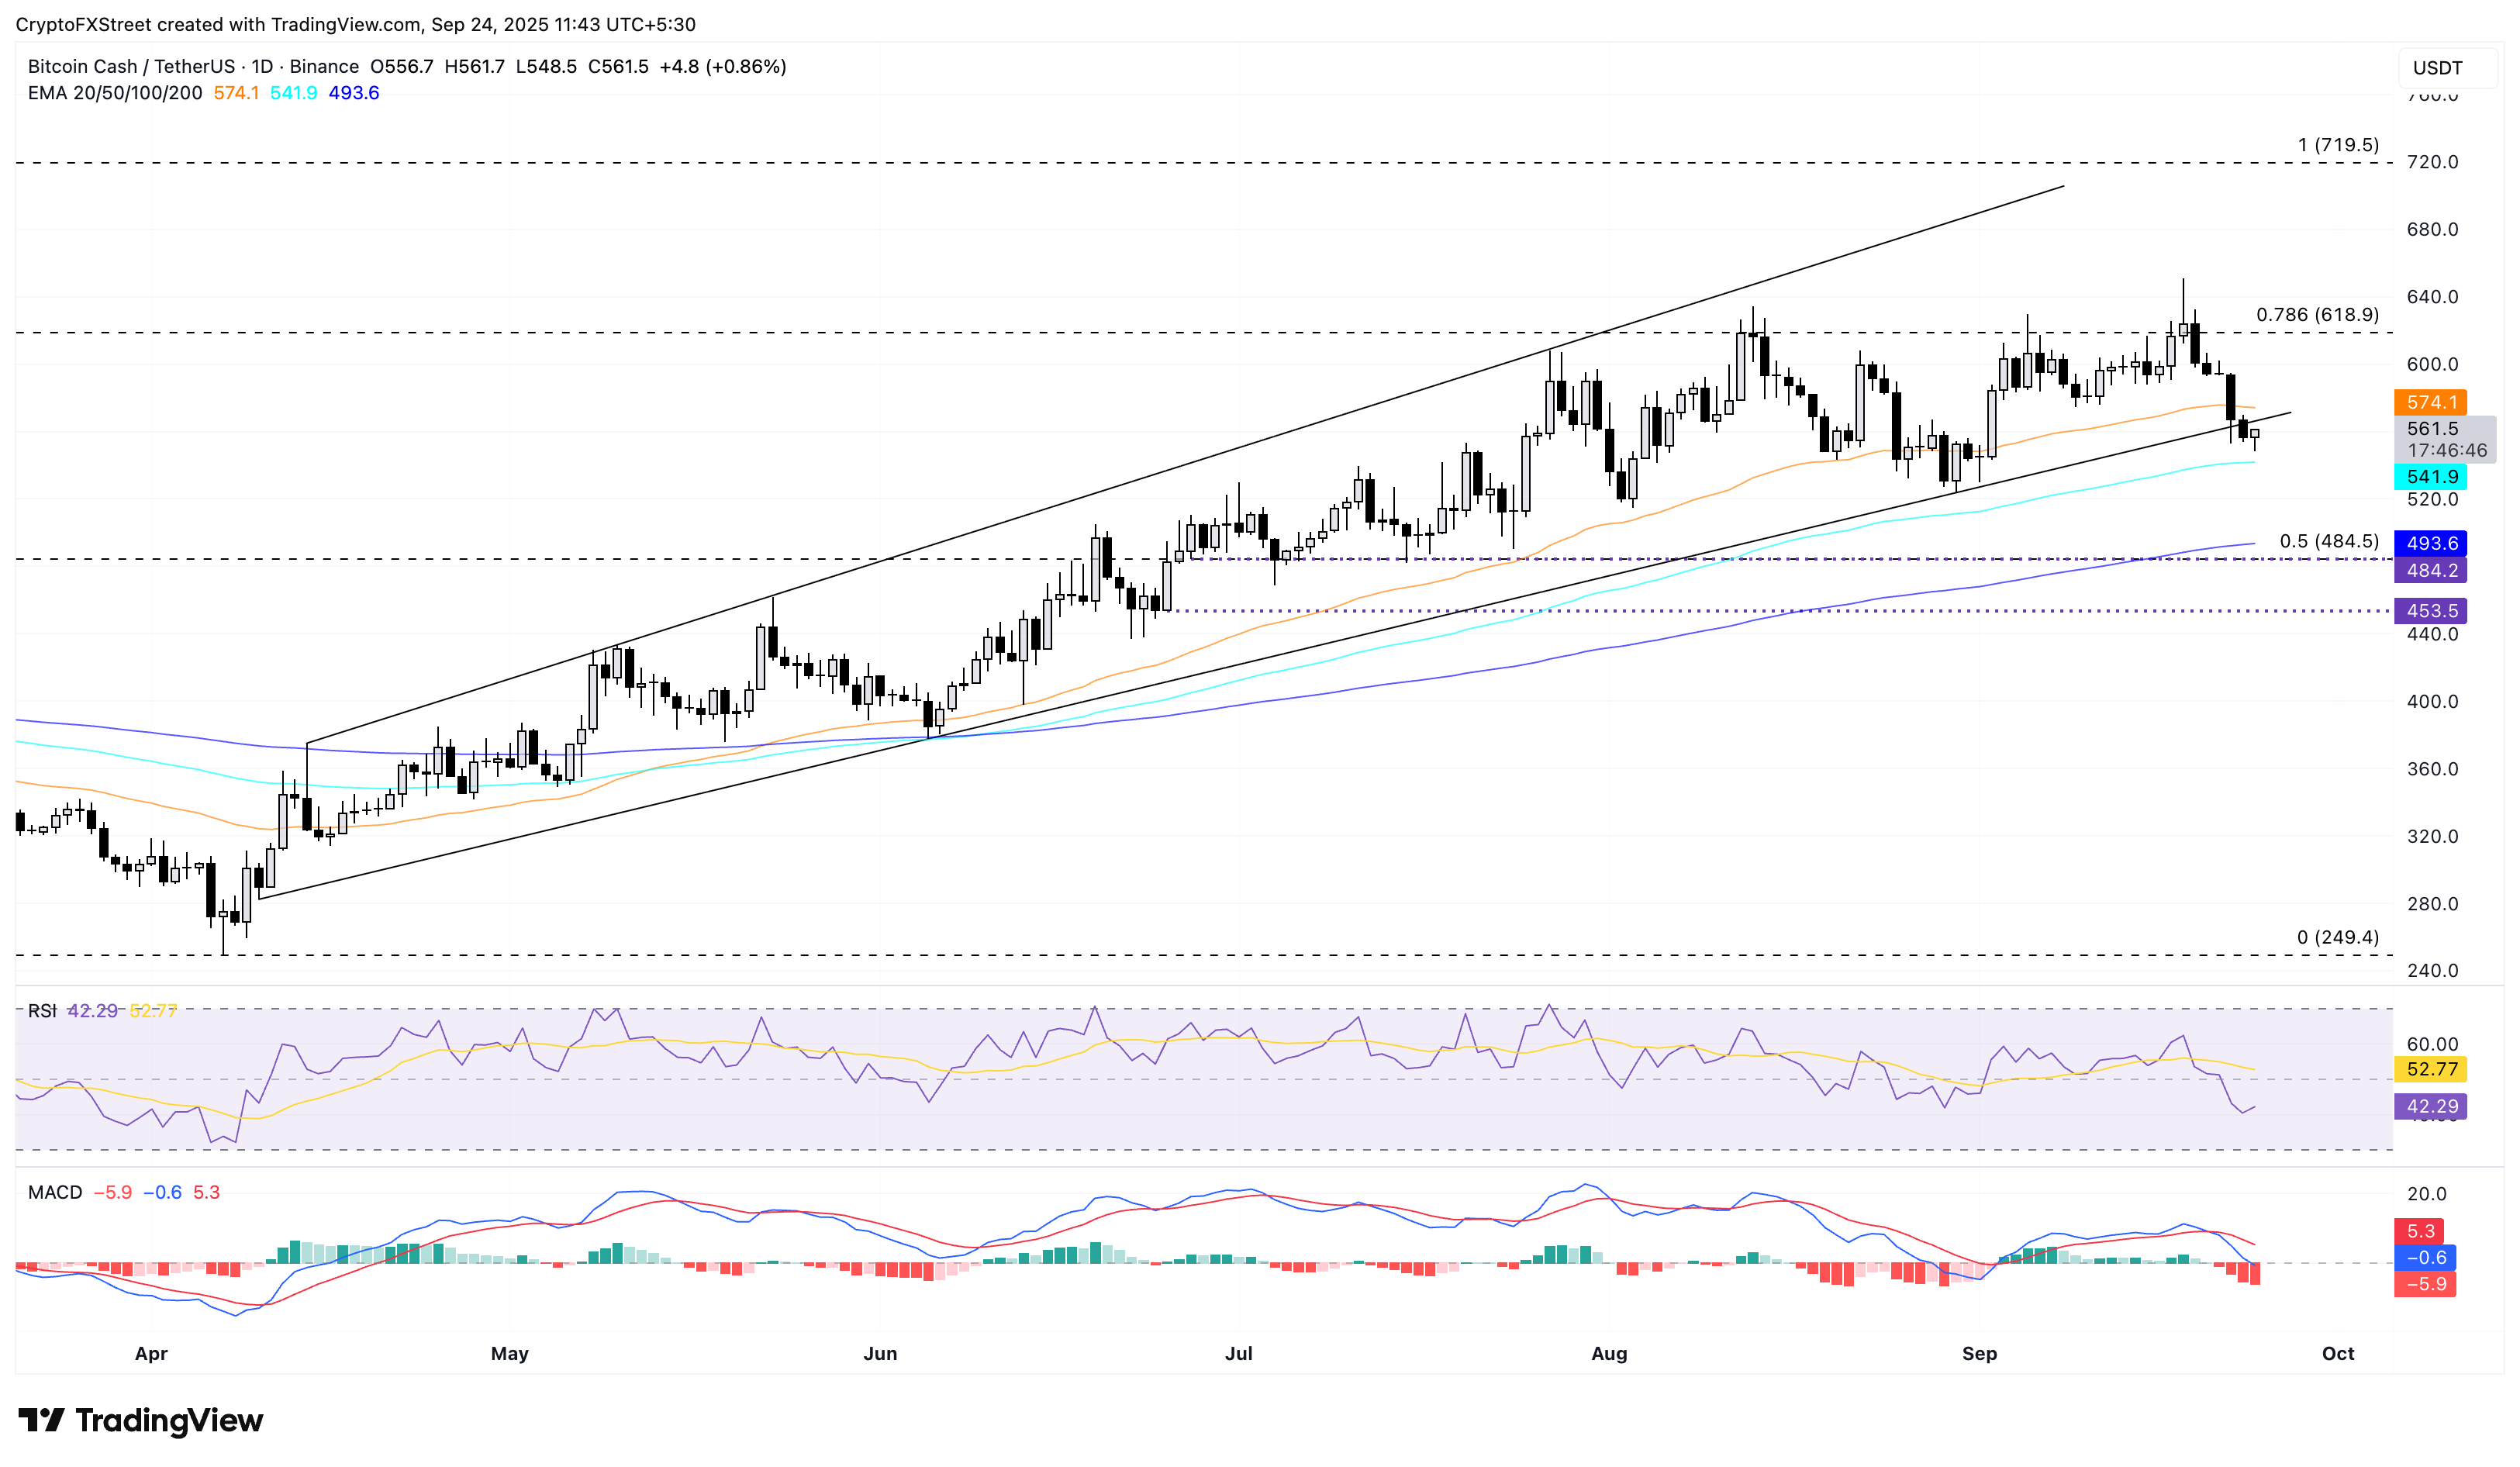
BCH/USDT daily price chart.
On the contrary, a potential extended recovery should reclaim the 50-day EMA at $574 to invalidate the breakdown of the channel pattern. In this case, a rebound to the 78.6% Fibonacci retracement level at $618 would be possible, retracing from the $640 high on December 6 to the $249 low on April 7.

FXStreet
超過一百萬用戶依賴 FXStreet 獲取即時市場數據、圖表工具、專家洞見與外匯新聞。其全面的經濟日曆與教育網路研討會協助交易者保持資訊領先、做出審慎決策。FXStreet 擁有約 60 人的團隊,分布於巴塞隆納總部及全球各地。
Read More


